Getting Started with TraceRecorder on ThreadX
This guide is for ThreadX version 6.0 or later, using Percepio TraceRecorder as tracing library. This guide assumes that GCC and make are used. The setup can be replicated with other tools, such as cmake. Contact support@percepio.com if you need help with this.
Note: While TraceRecorder supports tracing of the ThreadX kernel, it does not yet support tracing of the ThreadX middleware APIs (e.g. NetX). However, Tracealyzer also supports the legacy ThreadX tracer (tx_trace) which does support middleware tracing, although this is limited to snapshot traces. To use tx_trace instead, please refer to the Tracealyzer User Manual.
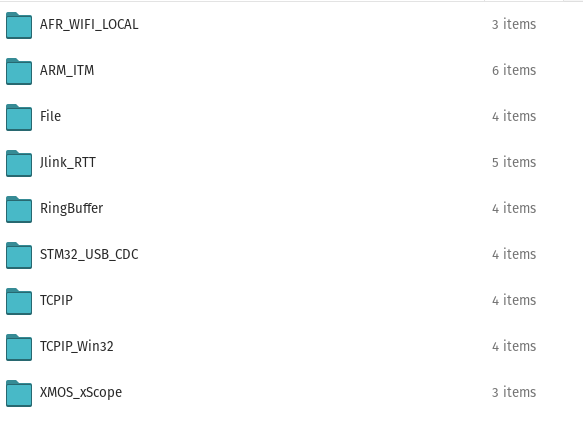
Copy the files into your project. The folder structure is a bit different depending on if the code is copied from the Tracealyzer installation directory or from the official git repository.
If the code is copied from the installation directory of Tracealyzer all files should be copied from the selected RTOS folder and the include and config subfolders.
If the code is copied from the git repository all c and h files should be copied into your project from the folders described below.
 /
 /config
 /include
 /kernelports/selected RTOS
 /kernelports/selected RTOS/config
 /kernelports/selected RTOS/include
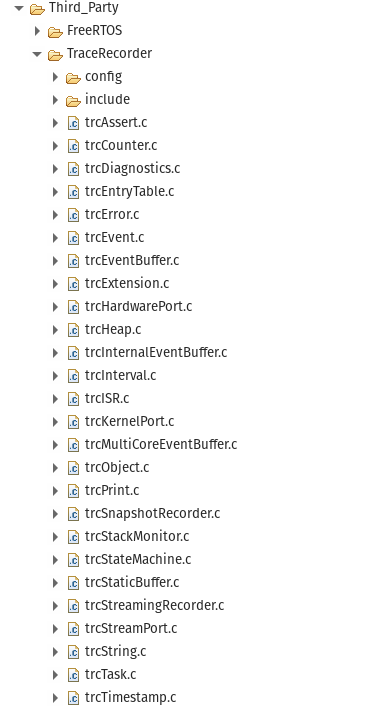
File structure with every h file in one config and one include folder.
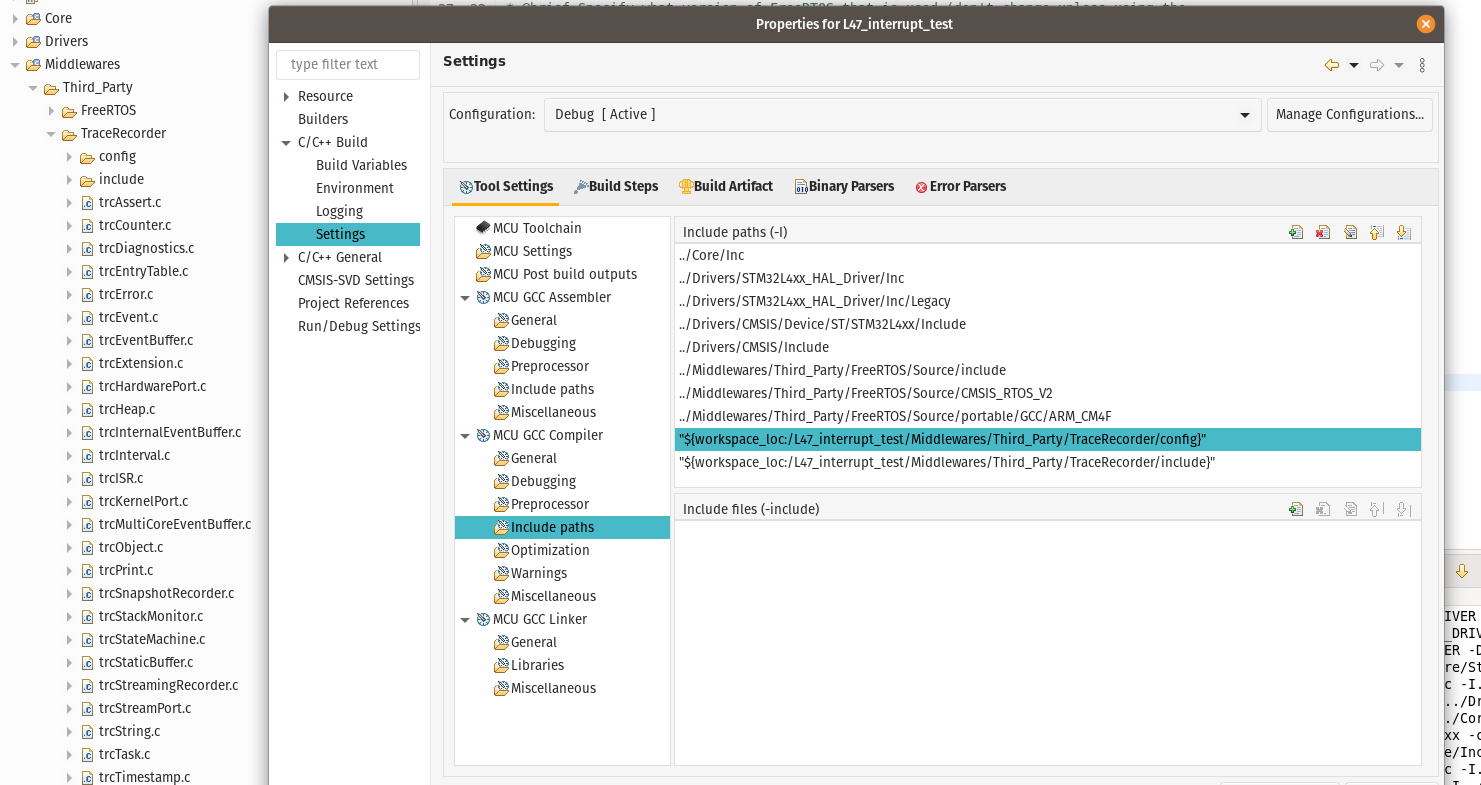
Make sure to add the path to the h files to the compiler’s “include paths” so the compiler can find them. This step is different depending on your development environment.
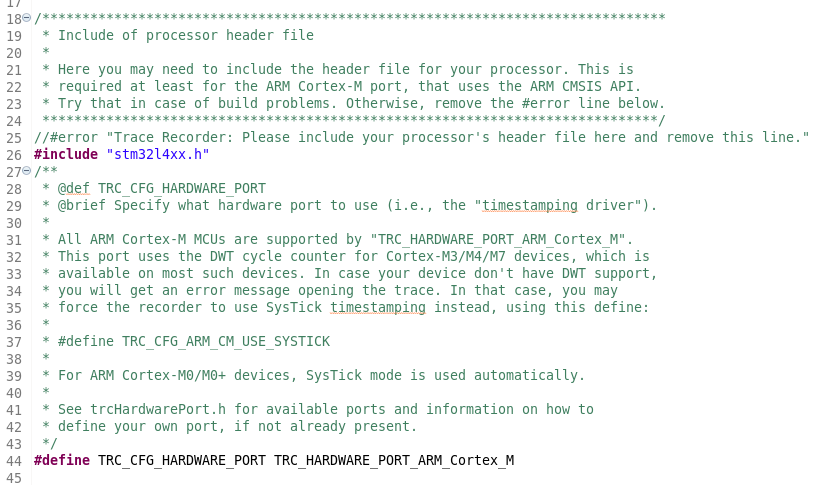
In trcConfig.h set
TRC_CFG_HARDWARE_PORTto the architecture used. For some hardware ports you need to#includethe processor header file by replacing the row#error "Trace Recorder: Please include your processor's header file here and remove this line.". If the error line is removed and your project compiles, the header file isn’t needed. All available hardware ports can be found at the bottom of trcDefines.h.
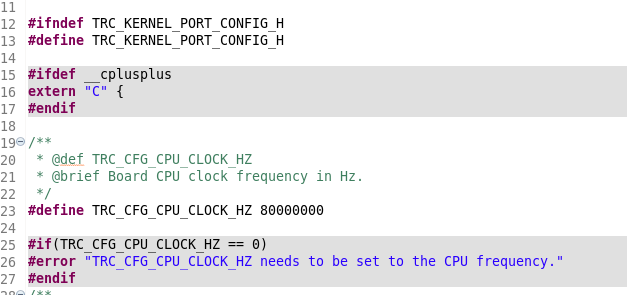
In trcKernelPortConfig.h set
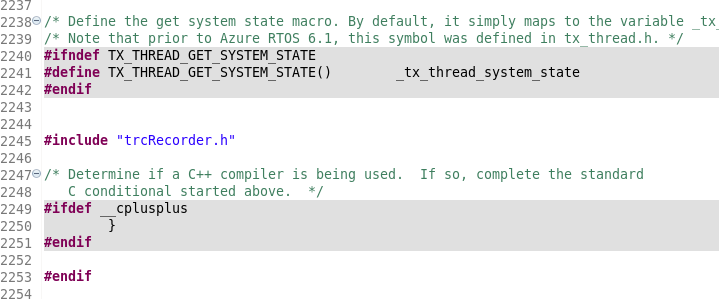
TRC_CFG_CPU_CLOCK_HZto the frequency used by the timer used for time stamping in the hardware port.Include trcRecorder.h at the end of tx_api.h and enable
TX_ENABLE_EVENT_TRACEeither in tx_user.h (make sureTX_INCLUDE_USER_DEFINE_FILEis defined) or by a compiler flag.Call
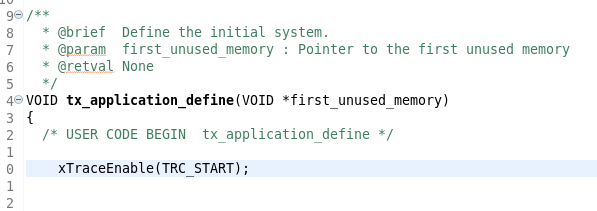
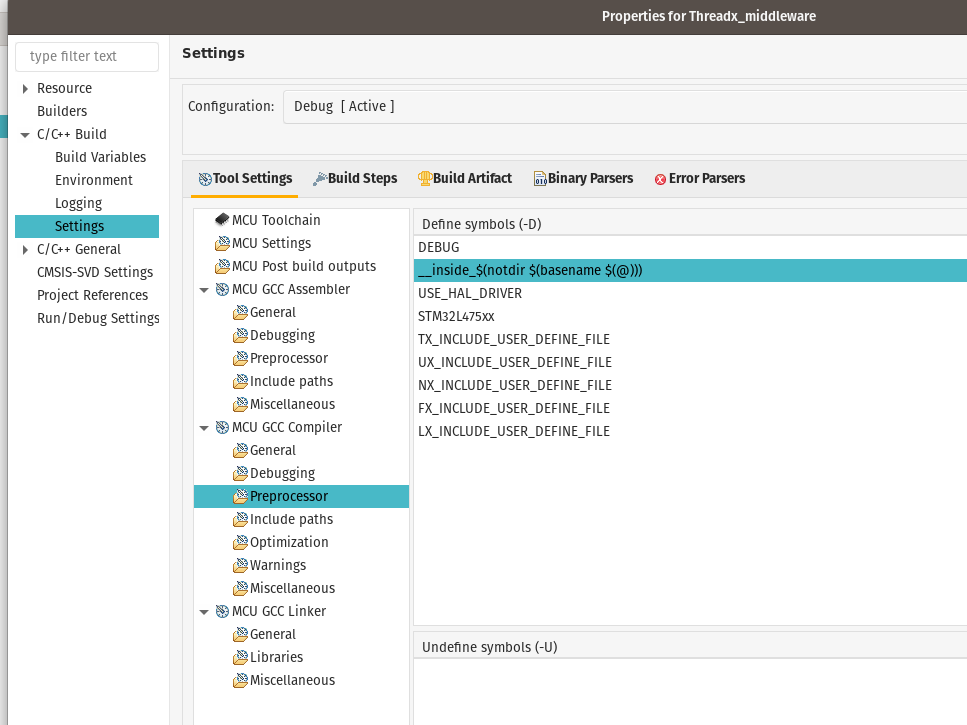
xTraceEnable()with the selected option at the top of thetx_application_definefunction. The arguments that can be used withxTraceEnable()areTRC_STARTthis starts the tracing directly this should be used in snapshot mode or streaming when no input from a host computer is needed, the next option isTRC_START_AWAIT_HOSTthis is used for streaming and will block until a start command are received from the host. The last option isTRC_START_FROM_HOST, this is used from streaming and will wait for a start command from the host computer to start tracing but this option is none blocking.In the project settings, add the following preprocessor definition:
__inside_$(notdir $(basename $(@))). This creates a preprocessor definition like__inside_myfilebased on the currently compiled .c file.Add
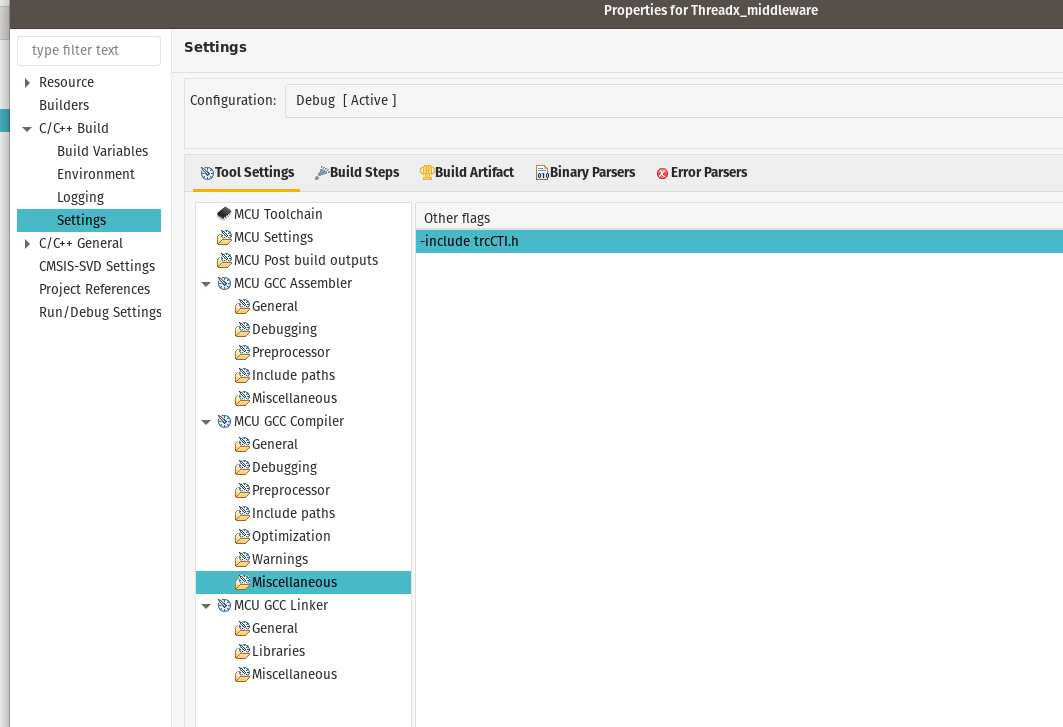
-include trcCTI.hin the GCC build flags. This will implicitly include trcCTI.h in every .c file. The purpose of trcCTI.h is to reroute the ThreadX API calls to the corresponding functions in trcCTI.c, that contain the event instrumentation.Configure the project for snapshot or streaming as described below.
Snapshot Trace
In snapshot tracing, trace data is stored in a local RAM buffer on the target device that can later be read from the host. The recorder can be configured to either stop or overwrite the start when the buffer becomes full.
Copy the files from the RingBuffer folder, located in the streamports folder, into your project. Make sure to include all .c files and the header files from the Config and Include folders.
For FreeRTOS make sure
TRC_CFG_RECORDER_MODEis set toTRC_RECORDER_MODE_STREAMINGin trcKernelPortConfig.h. As of v4.6 this is the default mode, and despite its name it supports both streaming and snapshots.For streamport-specific settings see trcStreamPortConfig.h
TRC_CFG_STREAM_PORT_BUFFER_SIZEdecides the size of the trace buffer that is stored in RAM.TRC_CFG_STREAM_PORT_RINGBUFFER_MODEcan be set toTRC_CFG_STREAM_PORT_RINGBUFFER_MODE_OVERWRITE_WHEN_FULLfor continuously recording orTRC_CFG_STREAM_PORT_RINGBUFFER_MODE_STOP_WHEN_FULLfor stopping when the buffer is full.
Now the project should compile and write data to the ring buffer, from which snapshots can be taken when the target is halted.
Note that the “Snapshot Mode” mentioned in trcKernelPortConfig.h (TRC_RECORDER_MODE_SNAPSHOT) refers to a legacy solution that is limited to snapshot tracing only. This mode is deprecated and is no longer recommended for new projects.
The default and recommended setting is “Streaming Mode” which allows for both streaming and snapshot tracing by selecting different stream ports. The RingBuffer stream port provides snapshot tracing support.
Reading a snapshot
There are a few ways to read a snapshot. More information is found in the Tracealyzer User Manual and also in some of the vendor-specific guides found on the main Getting Started page (e.g. for STM32CubeIDE, IAR and Keil).
For convenience we provide two examples below - the Percepio plugins for Eclipse and MPLAB X IDE. But basically you can use any method to save the contents of your RAM buffer to a .hex or .bin file, and then simply open that file in Tracealyzer.
The Eclipse plugin can be found on Eclipse Marketplace. This plugin will work for most versions of Eclipse. After the plugin has been installed the Percepio option can be found in the toolbar. To save a snapshot, start a debugging session, halt the application and then select Percepio -> Save Snapshot.
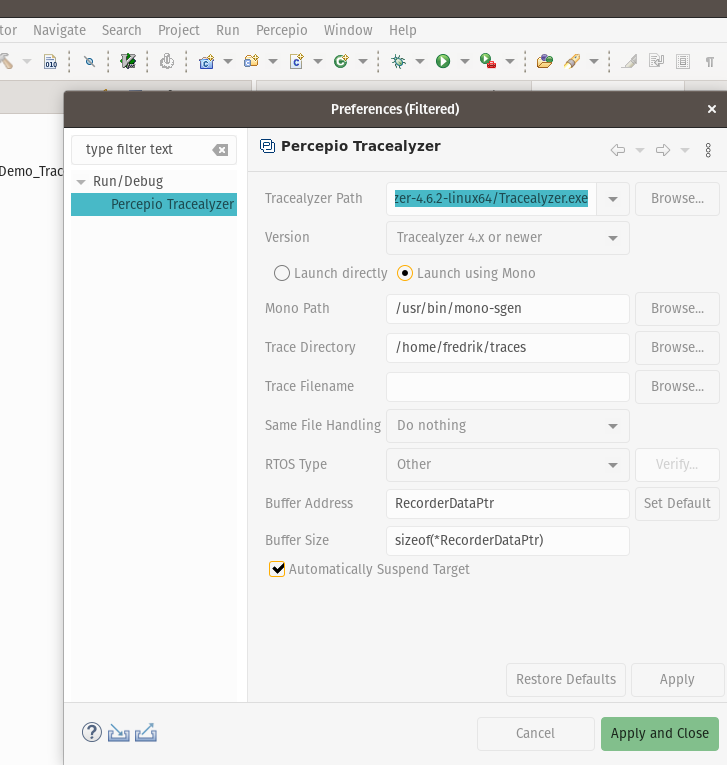
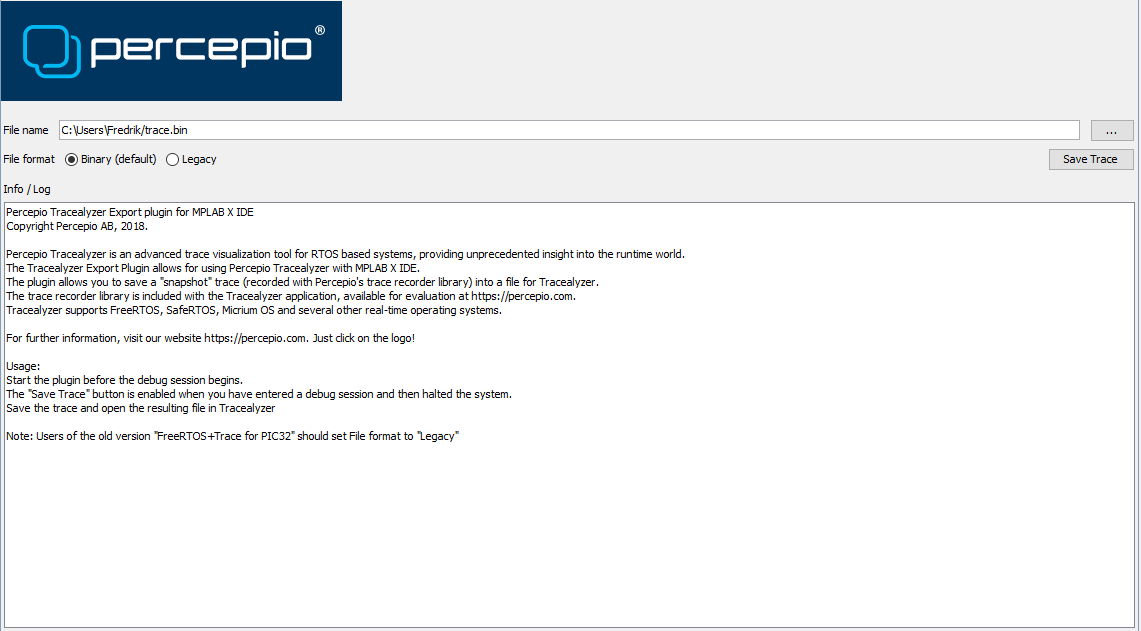
The MPLAB x plugin can be downloaded here then it can be installed following these instructions. To save a snapshot first open the Tracealyzer plugin by going to Tools -> Embedded -> Tracealyzer Export Plugin. Then start a debugging session, halt it, and press the “Save Trace” button.
Streaming
Streaming is a method where trace data are offloaded from the target continuously, this means that a streaming trace can run for hours or even days depending on the setup. The different streaming methods included can be found in the stream ports folder. If there are no stream ports available that work with the target and/or application a custom stream port can be made, as long as an interface with high enough bandwidth is used.
Follow the below steps to integrate a stream port:
Copy the files from the selected stream port into the project.
For FreeRTOS make sure
TRC_CFG_RECORDER_MODEis set toTRC_RECORDER_MODE_STREAMINGin trcKernelPortConfig.h.For stream port specific settings see trcStreamPortConfig.h
Now the project should compile and streaming can be started using the selected interface.
SEGGER J-Link Streaming
For SEGGER J-Link streaming a proprietary SEGGER feature called RTT, Real-Time Transfer, is used. This method utilizes a RAM buffer that the J-Link debugger can read during run time. Note: if you were already using RTT before adding Tracealyzer to your project, you can keep your RTT files as long as you make sure that your version of SEGGER_RTT_Conf.h is compatible with the one that Tracealyzer uses.
After the files have been included in the project from the Jlink_RTT folder as described in the streaming section the different configurations can be changed in trcStreamPortConfig.h. The different settings are:
TRC_CFG_STREAM_PORT_USE_INTERNAL_BUFFER, decides if an extra internal buffer should be used. This should be turned off in most cases when using this port.TRC_CFG_STREAM_PORT_INTERNAL_BUFFER_SIZE, sets the size of the internal buffer.TRC_CFG_STREAM_PORT_RTT_UP_BUFFER_SIZE, sets the size of the dedicated RTT output buffer.TRC_CFG_STREAM_PORT_RTT_UP_BUFFER_INDEX, defines the buffers RTT channel. 0 is reserved for for built in RTT functions and shouldn’t be used.TRC_CFG_STREAM_PORT_RTT_DOWN_BUFFER_INDEX, defines the RTT buffer channel for incoming data.TRC_CFG_STREAM_PORT_RTT_MODE, can be set toSEGGER_RTT_MODE_BLOCK_IF_FIFO_FULLorSEGGER_RTT_MODE_NO_BLOCK_SKIP. Where the first one will block the system until the whole buffer is cleared, this may disturb the real-time behavior of the system. The second option will generate missed events if the interface isn’t fast enough to clear the buffer.TRC_CFG_STREAM_PORT_RTT_NO_LOCK_WRITE, set this if RTT should write without locking. This should normally be disabled.
To connect to the target from Tracealyzer, open the settings and go to J-Link settings. Set the debugger, speed, interface and device to match the target.
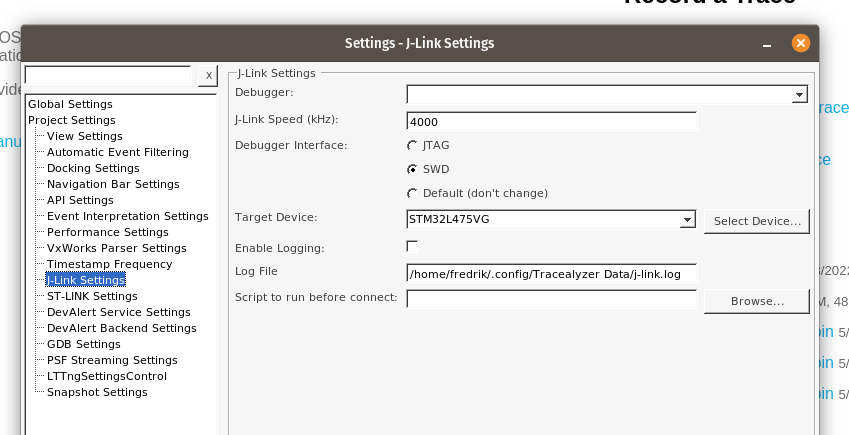
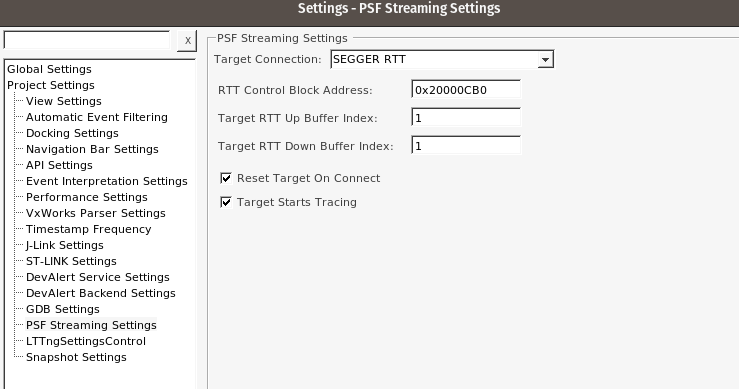
Go to PSF Streaming Settings and select SEGGER RTT as target connection. Sometimes the J-Link drivers cannot find the RTT control block, in that case the address can be set manually to the address of _SEGGER_RTT from the target (see note below). The up and down buffer index should be set to the same as in trcStreamPortConfig.h. If the argument TRC_START is used when calling xTraceEnable in the application, the Target Starts Tracing box should also be checked, otherwise it should be empty.
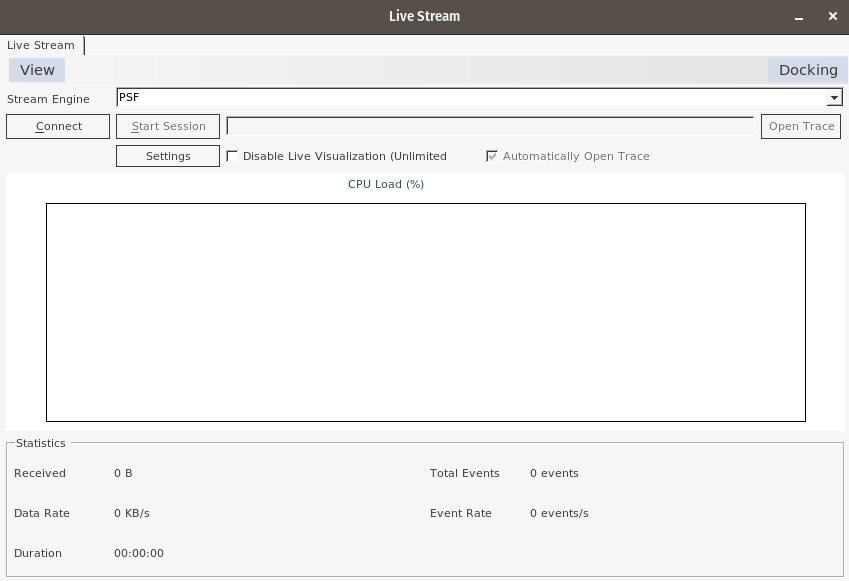
When all the settings are set, the settings window can be closed. Start streaming by pressing the connect button in the Live Stream window followed by pressing the Start Session button. If everything is set up correctly, data should now flow from the target.
More information about Segger RTT streaming, including a troubleshooting guide, is available at Using J-Link RTT Streaming.
Note: A common issue with Segger J-Link RTT streaming that the J-Link is unable to auto-detect the address of the RTT Control Block (see https://kb.segger.com/RTT#Auto-detection). It is recommended to check the status of the auto-detection, by following the following steps:
- First make sure that the xTraceEnable call has been executed and returned TRC_SUCCESS (= 0), e.g. by adding a printf that shows the xTraceEnable return value and checking that in the debug console log. In case of TRC_FAIL (= 1), step through the xTraceEnable function (trcStreamingRecorder.c) to see what check that failed.
- Then open the J-Link Control Panel in the web browser by visiting http://localhost:19080 or http://localhost:19081 - there might be two driver instances, one for the IDE and another for Tracealyzer.
- Open the "RTT" page, where you can find the "Status" field. It should say "Located RTT control block..." or similar. If it states "Looking for RTT CB..." or similar, the auto-detection has not (yet) been successful. In that case, please refer to Section 2 in the J-Link troubleshooting guide on Using J-Link RTT Streaming.