Getting started with TraceRecorder on Zephyr
Introduction
The Percepio TraceRecorder library is the target system component of Percepio Tracealyzer. The recorder comes pre-integrated as a configurable Zephyr module since Zephyr v2.6.
An example trace is included with the Tracealyzer application.
Setting up TraceRecorder
Assuming you are running Zephyr v3.0.0 or later, the trace recorder can be enabled in your application by following these steps:
Enable Zephyr Tracing Support (
CONFIG_TRACING)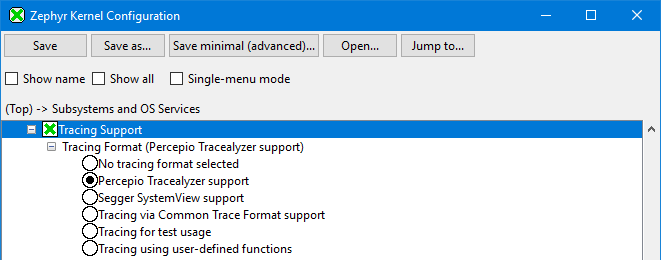
If you prefer editing your prj.conf directly, add
CONFIG_TRACING=y
Enable Percepio Tracealyzer Tracing Format (
CONFIG_PERCEPIO_TRACERECORDER).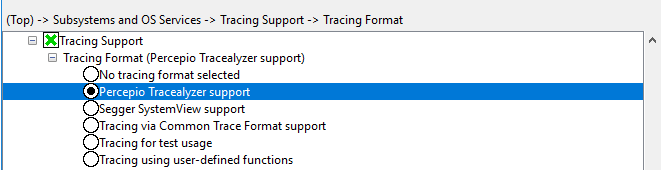
Or in prj.conf, add:
CONFIG_PERCEPIO_TRACERECORDER=y
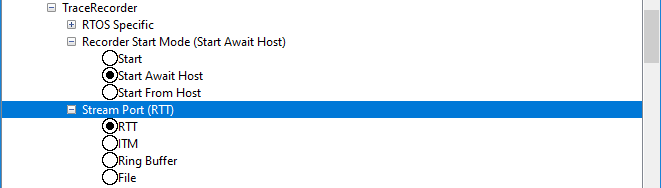
Decide on which stream port to use, i.e., how to transfer the trace data from target to host. If you have a Segger J-Link, select RTT to stream the data over the J-Link RTT protocol. ITM refers to the Arm Cortex-M ITM unit, where the data can be provided over the SWO pin.
Or in prj.conf, include one of the following options:
CONFIG_PERCEPIO_TRC_CFG_STREAM_PORT_RINGBUFFER=y
CONFIG_PERCEPIO_TRC_CFG_STREAM_PORT_RTT=y
CONFIG_PERCEPIO_TRC_CFG_STREAM_PORT_ITM=y
CONFIG_PERCEPIO_TRC_CFG_STREAM_PORT_FILE=y
Select desired Recorder Start Mode. For RingBuffer, ITM and File, use the "Start" option (starts tracing directly). For RTT, it is recommended to use "Start From Host", where the tracing is started when a trace start command is received from Tracealyzer. The "Start Await Host" works like "Start From Host" but blocks the system until the start command is received, which is useful for tracing the startup sequence.
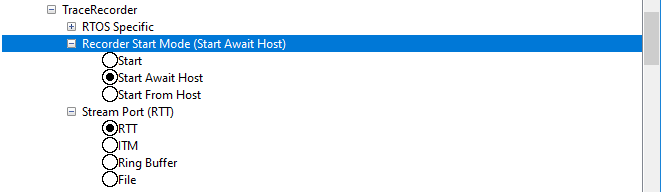
Or in prj.conf, include one of the following options:
CONFIG_PERCEPIO_TRC_START_MODE_START=y
CONFIG_PERCEPIO_TRC_START_MODE_START_FROM_HOST=y
CONFIG_PERCEPIO_TRC_START_MODE_START_AWAIT_HOST=y
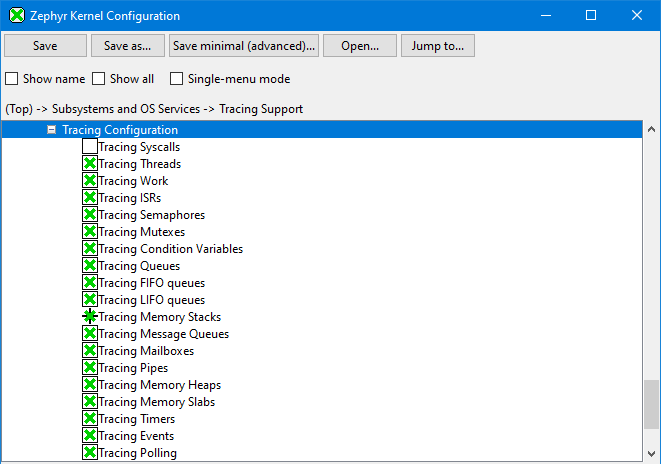
Select desired Tracing Configuration. We recommend to disable Syscall tracing. This is a "catch-all" for Syscall events lacking proper instrumentation. Most Zephyr kernel events are covered by the other categories. The Syscall category may include very frequent events causing higher tracing overhead.
-
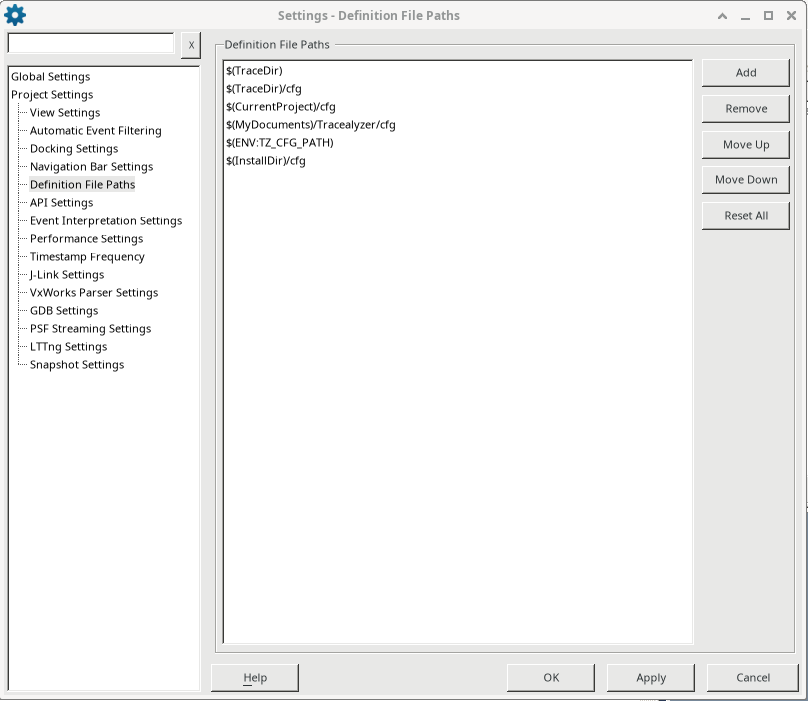
In Tracealyzer, add the path to your Zephyr build folder in File -> Settings -> Project Settings -> Definition File Paths.
-
A full rebuild (--pristine) is recommended after enabling TraceRecorder. It might also be needed after changing the tracing settings, or if Zephyr has been updated and the list of syscalls has changed.
-
If you want to use SEGGER J-Link streaming, please refer to the Using J-Link RTT Streaming guide. For other configurations, please refer to the Tracealyzer User Manual (included with the application), under Creating and Loading Traces -> Percepio TraceRecorder -> Using TraceRecorder v4.6 or later.
If you run into problems, please refer to the Troubleshooting section.
Configuration
The following settings are available for tuning the the trace recorder configuration:
Recorder Start Mode
CONFIG_PERCEPIO_TRC_START_MODE_START: Specifies that the tracing should start directly when the Zephyr Kernel starts.CONFIG_PERCEPIO_TRC_START_MODE_START_AWAIT_HOST: For streaming mode only. Initializes the trace recorder and waits for a Start command from Tracealyzer before the application start.CONFIG_PERCEPIO_TRC_START_MODE_START_FROM_HOST: For streaming mode only. Initializes the trace recorder if necessary and creates a task that waits for a Start command from Tracealyzer (“Start Recording” button). This call is not blocking.
Recorder Allocation Mode
Specifies how the recorder buffer is allocated (also in case of streaming, in port using the recorder’s internal temporary buffer)
CONFIG_PERCEPIO_TRC_RECORDER_BUFFER_ALLOCATION_STATIC: Static allocation (internal)CONFIG_PERCEPIO_TRC_RECORDER_BUFFER_ALLOCATION_DYNAMIC:k_heap_alloc, requires Zephyr kernel heap and enough allocated memory.CONFIG_PERCEPIO_TRC_RECORDER_BUFFER_ALLOCATION_CUSTOM: UsevTraceSetRecorderDataBuffer.
Control Task
CONFIG_PERCEPIO_TRC_CFG_CTRL_TASK_PRIORITY: In streaming mode, TzCtrl is used to receive start/stop commands from Tracealyzer and in some cases also to transmit the trace data (for stream ports that use the internal buffer, like TCP/IP). For such stream ports, make sure the TzCtrl priority is high enough to ensure reliable periodic execution and transfer of the data, but low enough to avoid disturbing any time-sensitive functions.CONFIG_PERCEPIO_TRC_CFG_CTRL_TASK_DELAY: The delay between loops of the TzCtrl task (seeCONFIG_PERCEPIO_TRC_CFG_CTRL_TASK_PRIORITY), which affects the frequency of the stack monitoring.CONFIG_PERCEPIO_TRC_CFG_CTRL_TASK_STACK_SIZE: The stack size of the Tracealyzer Control (TzCtrl) task. SeeCONFIG_PERCEPIO_TRC_CFG_CTRL_TASK_PRIORITYfor further information about TzCtrl.
Stack Monitor
CONFIG_PERCEPIO_TRC_CFG_ENABLE_STACK_MONITOR: If enabled, the recorder periodically reports the unused stack space of all active tasks. The stack monitoring runs in the Tracealyzer Control task, TzCtrl.CONFIG_PERCEPIO_TRC_CFG_STACK_MONITOR_MAX_TASKS: Specifies This controls how many tasks can be monitored by the stack monitor. If this is too small, some tasks will be excluded and a warning is shown.CONFIG_PERCEPIO_TRC_CFG_STACK_MONITOR_MAX_REPORTS: This defines how many tasks that will be subject to stack usage analysis for each execution of the Tracealyzer Control task (TzCtrl). Note that the stack monitoring cycles between the tasks, so this does not affect WHICH tasks are monitored, but HOW OFTEN each task stack is analyzed.
ISR Tracing
CONFIG_PERCEPIO_CFG_MAX_ISR_NESTING: Defines how many levels of interrupt nesting the recorder can handle, in case multiple ISRs are traced and ISR nesting is possible. If this is exceeded, the particular ISR will not be traced and the recorder then logs an error message. This setting is used to allocate an internal stack for keeping track of the previous execution context (4 bytes per entry).CONFIG_PERCEPIO_TRC_CFG_ISR_TAILCHAINING_THRESHOLD: If tracing multiple ISRs, this setting allows for accurate display of the context-switching also in cases when the ISRs execute in direct sequence. vTraceStoreISREnd normally assumes that the ISR returns to the previous context, i.e., a task or a preempted ISR. But if another traced ISR executes in direct sequence, Tracealyzer may incorrectly display a minimal fragment of the previous context in between the ISRs. By usingCONFIG_PERCEPIO_TRC_CFG_ISR_TAILCHAINING_THRESHOLDyou can avoid this. This is however a threshold value that must be measured for your specific setup. The default setting is 0, meaning “disabled” and that you may get an extra fragments of the previous context in between tail-chained ISRs.
Streaming Config
CONFIG_PERCEPIO_TRC_CFG_ENTRY_SLOTS- The maximum number of symbols names that can be stored, including names for tasks and traced ISRs, other named kernel objects and user event channels.CONFIG_PERCEPIO_TRC_CFG_ENTRY_SYMBOL_MAX_LENGTH- The maximum length of symbol names.
Streamport RTT Config
CONFIG_PERCEPIO_TRC_CFG_STREAM_PORT_RTT_UP_BUFFER_SIZE: Defines the size of the “up” RTT buffer (target -> host) to use for writing the trace data, for RTT buffer 1 or higher. This setting is ignored for RTT buffer 0, which can’t be reconfigured in runtime and therefore hard-coded to use the defines in SEGGER_RTT_Conf.h. Default buffer size for Tracealyzer is 5000 bytes. If you have a stand-alone J-Link probe, the can be decreased to around 1 KB. But integrated J-Link OB interfaces are slower and needs about 5-10 KB, depending on the amount of data produced.CONFIG_PERCEPIO_TRC_CFG_STREAM_PORT_RTT_DOWN_BUFFER_SIZE: Defines the size of the “down” RTT buffer (host -> target) to use for reading commands from Tracealyzer, for RTT buffer 1 or higher.CONFIG_PERCEPIO_TRC_CFG_STREAM_PORT_RTT_UP_BUFFER_INDEX: Defines the RTT buffer to use for writing the trace data. Make sure that the PC application has the same setting (File->Settings).CONFIG_PERCEPIO_TRC_CFG_STREAM_PORT_RTT_DOWN_BUFFER_INDEX: Defines the RTT buffer to use for reading the trace data. Make sure that the PC application has the same setting (File->Settings).CONFIG_PERCEPIO_TRC_CFG_STREAM_PORT_RTT_MODEThis stream port for J-Link streaming relies on SEGGER RTT, that contains an internal RAM buffer read by the J-Link probes during execution.CONFIG_PERCEPIO_TRC_CFG_STREAM_PORT_RTT_MODE_BLOCK_IF_FIFO_FULL: Ensure that you get a complete and valid trace. This may however cause blocking if your streaming interface isn’t fast enough, which may disturb the real-time behavior.CONFIG_PERCEPIO_TRC_CFG_STREAM_PORT_RTT_MODE_NO_BLOCK_SKIP: In this mode, Tracealyzer will report lost events if the transfer is not fast enough. In that case, try increasing the size of the “up buffer”.
Streamport ITM Config
CONFIG_PERCEPIO_TRC_CFG_ITM_PORT: What ITM port to use for the trace data.
Streamport Ringbuffer Config
CONFIG_PERCEPIO_TRC_CFG_STREAM_PORT_RINGBUFFER_SIZE: Defines the size of the ring buffer use for storing trace events.CONFIG_PERCEPIO_TRC_STREAM_PORT_RINGBUFFER_MODE_OVERWRITE_WHEN_FULL: Configures the ring buffer to overwrite old events when full.CONFIG_PERCEPIO_TRC_STREAM_PORT_RINGBUFFER_MODE_STOP_WHEN_FULL: Configures the ring buffer to stop accepting new events when full.
Troubleshooting
Recorder error reporting facilities
Runtime errors in the recorder are captured by the ASSERT macros. Upon detecting an internal error within the recorder codebase, the functions xTraceError or xTraceWarning are called, resulting in an attempt at saving the error message and stopping the recorder. Once the trace is opened, the aforementioned error message will be displayed.
Example causes to when internal Recorder errors are triggered are incorrect parameters being provided to the recorder, or an invalid recorder configuration being provided.
In the case of no error being presented (or cases where the context of the error is needed), a breakpoint can be set on xTraceError and/or xTraceWarning.
To retrieve the last error reported during runtime, the function xTraceErrorGetLast can be called.
Hard faults
A common cause to hard faults appearing after adding the recorder to your application is stack overflows. Due to the additional instrumentation the trace recorder provides, additional function calls will be added to the call stacks, resulting in a slightly increased stack usage. I.e if any of your threads are their stack size limit, the additional function calls caused by the recorder might be the straw that broke the camel’s back. To alleviate this issue, try increasing the stack size of the threads which are running into this problem.
Connectivity issues
In case you have problems connecting to the recorder in streaming mode, or it reports lost events, make sure to check the following.
Problems connecting/No events being reported
Double-check the streaming settings in Tracealyzer (File -> Settings). Also check that the stream port settings match where relevant.
Using a SEGGER J-Link and RTT streaming? See Troubleshooting J-Link RTT streaming
Verify that tracing is properly started, which can be done by putting a breakpoint on the
xTraceEnable()function, which can be found in<path_to_your_zephyr_workspace>/modules/debug/TraceRecorder/trcStreamingRecorder.c.If Recorder Start Mode (found in Modules -> TraceRecorder) is configured to Start From Host (
CONFIG_PERCEPIO_RECORDER_CFG_START_MODE_START_FROM_HOST=y) or Start Await Host (CONFIG_PERCEPIO_RECORDER_CFG_START_MODE_START_AWAIT_HOST), theprvSetRecorderEnabledfunction is only called when the “start tracing” command is received from Tracealyzer. If the breakpoint never is reached, this indicates that the aforementioned start command never was received.If Recorder Start Mode is configured to Start using
CONFIG_PERCEPIO_RECORDER_CFG_START_MODE_START=ytheprvSetRecorderEnabledfunction is called directly from withinxTraceEnable.
Is the trace control task (TzCtrl) executing? Put a breakpoint in the start of this task to verify this. Note that TzCtrl normally is started automatically from vTraceEnable.
Lost Events
Is your streaming interface sufficiently fast to handle the data produced? If not, there may be lost events or blocking in the recorder, depending on your recorder settings.
If blocking mode is used, this may affect the timing of your system, but ensures that data is not lost. In case of data loss, Tracealyzer will show a counter for “dropped events” in the “Connect to target system” window.
Make sure the trace buffer is sufficiently large. If using J-Link streaming, the buffer size setting can be set with the
CONFIG_PERCEPIO_RECORDER_TRC_CFG_RTT_BUFFER_SIZE_UPoption.Try making the TzCtrl task execute more frequently. This can be configured in Modules -> TraceRecorder -> Control Task (
CONFIG_PERCEPIO_RECORDER_CFG_CTRL_TASK_DELAY).In case there is unused RAM available, the buffer size can be increased. You can find these options in Modules -> TraceRecorder -> <stream port type used> Config, below Use Internal Buffer.
If your system is highly loaded, you might need to increase the priority of the trace control task to make sure it runs periodically. This is done by decreasing the priority of the TzCtrl task. You can find this option in Modules -> TraceRecorder -> Control Task (
CONFIG_PERCEPIO_RECORDER_CFG_CTRL_TASK_PRIORITY).Check if you get any warnings related to
TRC_STREAM_PORT_WRITE_DATAorTRC_STREAM_PORT_READ_DATA. These define the I/O functions used by the stream port to read commands and write trace data, and should return zero (0) on success. Any other return values result in warnings (e.g. “TRC_STREAM_PORT_WRITE_DATAreturned error (!= 0)”). This can be checked by callingxTraceErrorGetLast()(returns a string, or NULL if no error), or by placing a breakpoint inxTraceWarning().
Finally, please don’t hesitate to contact support@percepio.com if you need any assistance.
The Syscall Extension
This feature provides a more efficient way to trace syscall events, by using numeric event codes (one code per syscall) instead of logging the syscall names as strings. This option is enabled by default in more recent versions of TraceRecorder.
Here is how it works:
The Use Syscall Extension option is found under Modules -> TraceRecorder -> RTOS Specific. This is enabled by default.
After building your Zephyr project with TraceRecorder included, a file called syscalls-x.x.x.xml is created in the build folder (where x.x.x is the Zephyr version number). This file is needed by Tracealyzer to translate the syscall event codes into syscall names. For Tracealyzer to find this file, you need to add the path to your Zephyr build folder in the Tracealyzer Settings (File -> Settings -> Project Settings -> Definition File Paths).
In Tracealyzer, go to File -> Settings
Under Project Settings, add the path to the build folder of the application you wish to trace.
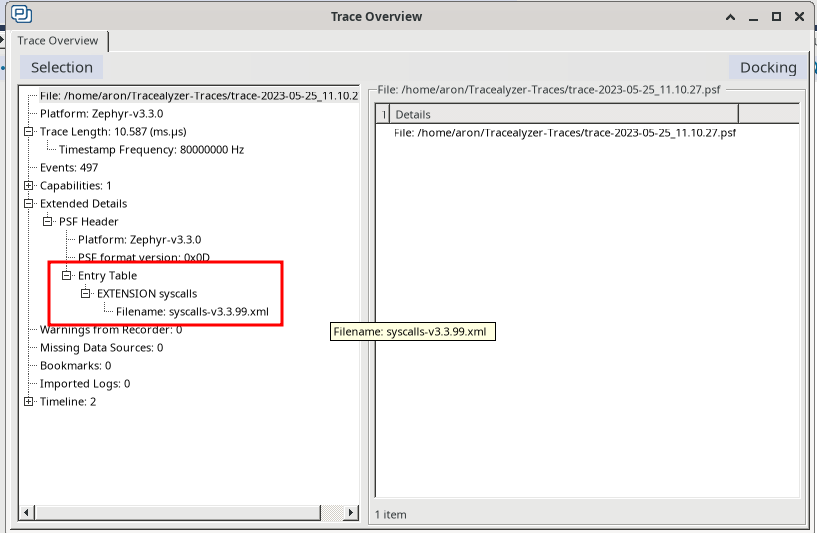
Start a new live trace for your device.
To verify that the syscalls extension has been enabled, go to View -> Trace Overview. Under Extended Details -> PSF Header -> Extensions, you should see an extension called syscalls-x.x.x.xml, where x.x.x is the version of zephyr you’re using.