ESP-IDF
The sections below covers the information necessary for using Percepio TraceRecorder with Espressif’s ESP-IDF framework and ESP32 targets.
Getting Started with Tracealyzer for ESP-IDF FreeRTOS
-
Download and install Tracealyzer from https://percepio.com/tracealyzer/download-tracealyzer/. The download link is emailed to you and usually arrives within 1 minute.
-
Locate and open FreeRTOS.h from your ESP-IDF installation. This is typically found in:
<User Home Directory>/esp/<version>/esp-idf/components/freertos/FreeRTOS-Kernel/include/freertosAdd the following code right after
#include "FreeRTOSConfig.h":#ifdef CONFIG_PERCEPIO_TRACERECORDER_ENABLED #include <trcRecorder.h> #endif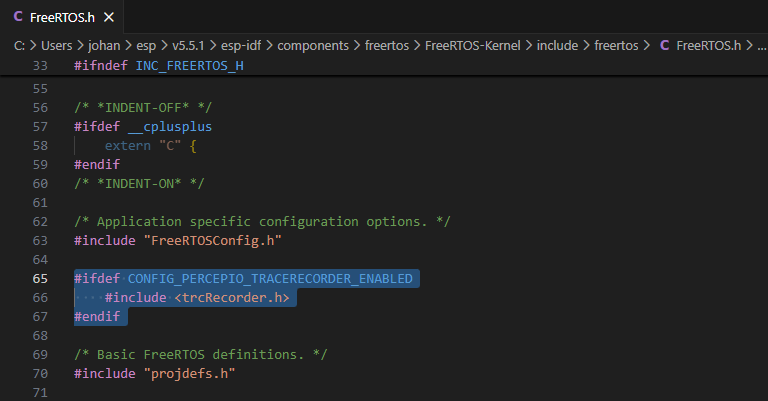
-
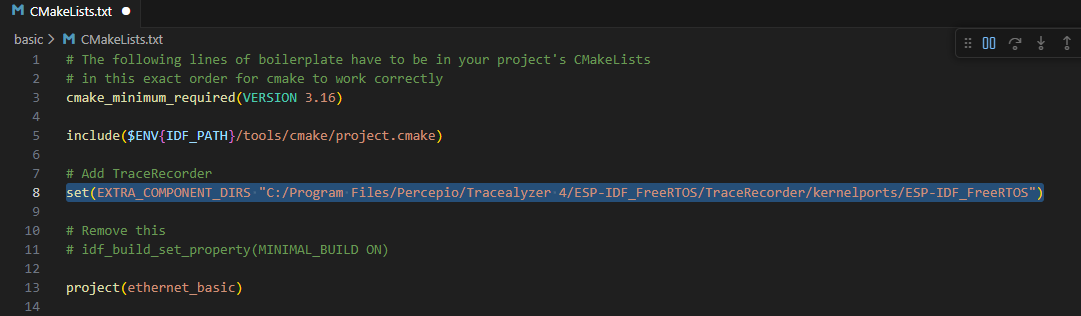
Open your project's CMakeLists.txt and make the following changes:
-
Add the following, as shown below.
set(EXTRA_COMPONENT_DIRS <TraceRecorderPath>/kernelports/ESP-IDF_FreeRTOS)
If using Windows, make sure to use forward-slashes and quotation marks around paths containing spaces. -
Disable MINIMAL_BUILD if present, like shown below, to ensure TraceRecorder is included in the build.
-
-
Rebuild your application to make the TraceRecorder settings appear in menuconfig.
-
If using the Visual Studio Code extension, open the ESP-IDF Explorer tab and select "SDK Configuration Editor (menuconfig).
Otherwise, open the menuconfig tool from the command line by runningidf.py menuconfig.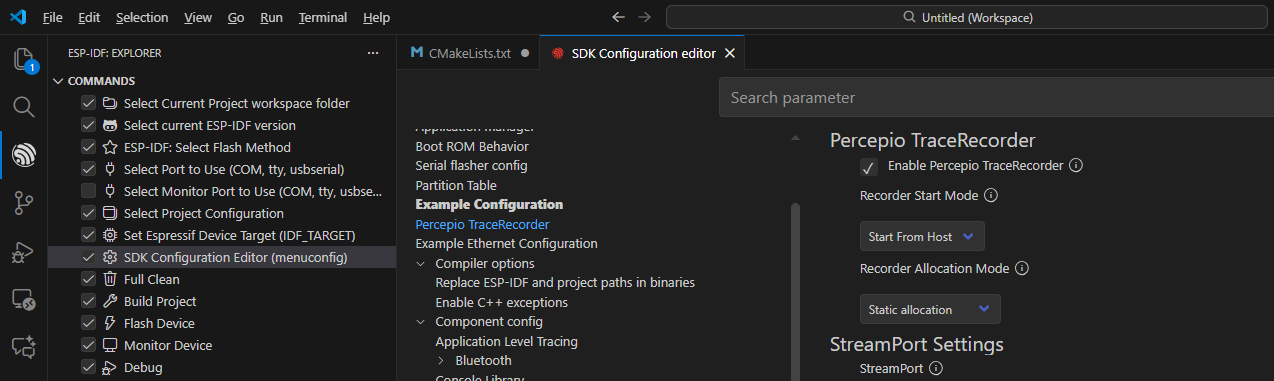
-
Navigate to "Percepio TraceRecorder" and enable the Enable Percepio TraceRecorder option. (If it doesn't show up, double-check that your CMakeLists.txt has been updated with the correct path and do a clean rebuild.)
Decide how you want to output the trace by selecting the StreamPort.
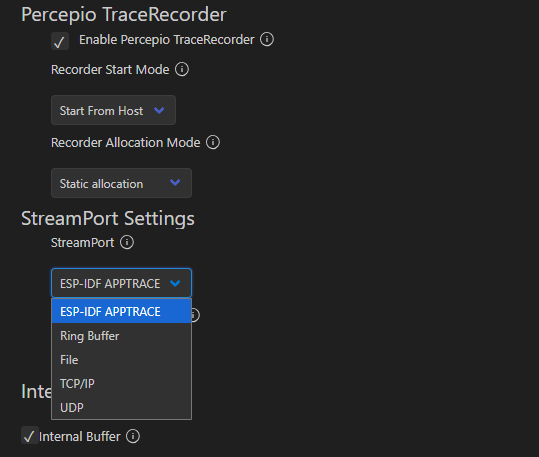
If you have a debug connection to the device, it is easiest to start with the RingBuffer streamport.
This writes the trace data to a device RAM buffer, by default 10 KB but the size is adjustable.
The buffer can be stored to a file when the device is halted to capture a snapshot of the most recent events.If your device has an Ethernet connection, you may leverage the TCP/IP or UDP streamports to stream the trace data.
Otherwise, you may use the ESP-IDF APPTRACE streamport to stream the trace over the debug connection.
The Ethernet-based options offer far higher throughput than APPTRACE, although at the cost of higher CPU load. -
Read the specific instructions for your selected streamport (see below) and apply the recommended settings.
-
Save the settings.
-
Do a clean, full rebuild the first time. Flash and start your system.
-
Start Tracealyzer and open the User Manual (Help menu).
-
Read the User Manual section "Creating and Loading Traces", explaining how to record traces. Key pointers are provided below.
- For trace streaming, configure Tracealyzer under File -> Settings -> PSF Streaming Settings, matching the selected streamport module. Learn more in the User Manual (search for streaming trace).
- If using the Ring Buffer streamport, see Using Tracealyzer with VS Code for tips how to save snapshots via the debugger connection.
Streamport Options
-
Streamport "Ring Buffer"
The Ring Buffer streamport keeps the trace data in a target-side RAM buffer, which can then be transferred off the device using the debug connection.
ESP-IDF Configuration for Ring Buffer
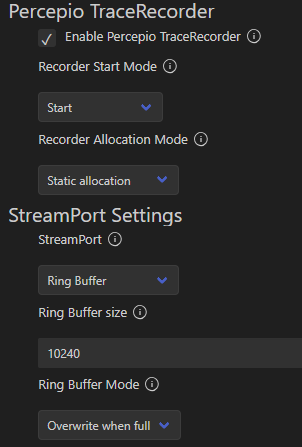
- Percepio TraceRecorder - Recorder Start Mode: "Start", meaning the tracing begins during startup.
- StreamPort Settings - StreamPort: "Ring Buffer"
- StreamPort Settings - Ring Buffer Size: The trace buffer size in bytes. Decides how long traces that can be stored. Use the default size to begin with (10 KB = 10240), modify if needed.
-
StreamPort Settings - Ring Buffer Mode: What to do when the buffer becomes full.
- Overwrite: For seeing the last events just before the snapshot.
- Stop: Preserves the earlier events in the buffer. Useful for capturing startup events.
- Trace Control Task - Control Task Stack Size: 256 (default)
To store snapshots from the trace buffer, open the ESP-IDF Debug Console in VS Code and enter:
> dump binary value trace.bin *RecorderDataPtr
>character.To repeat the snapshot command, use the UP arrow in the ESP-IDF Debug Console to retreive previous commands.
Another way is to configure the Tracealyzer GDB integration to allow storing snapshots using the Take Snapshot button.
-
Streamport "TCP/IP"
The TCP/IP streamport uses TCP sockets to transfer the trace data. On multicore devices, TraceRecorder creates one socket for each core.
ESP-IDF Configuration for TCP/IP
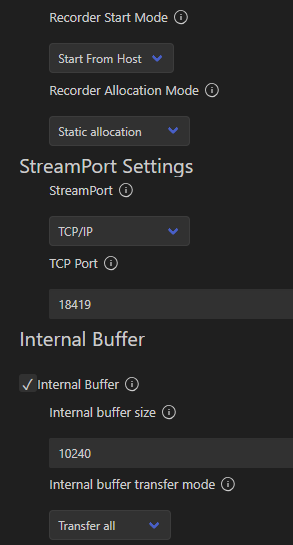
- Percepio TraceRecorder - Recorder Start Mode: "Start From Host" is recommended, meaning the tracing begins when a start command is received from the host application.
- StreamPort Settings - StreamPort: TCP/IP
- Internal Buffer - Internal buffer: Enabled
- Internal Buffer - Internal buffer size: 10 - 16 KB is recommended to begin with, but depends on system event rate. Adjust as needed to minimize missed events and memory usage.
- Internal Buffer - Internal buffer transfer mode: "Transfer All" is recommended in most cases.
- Trace Control Task - Control Task Stack Size: 512 is recommended (256 not enough)
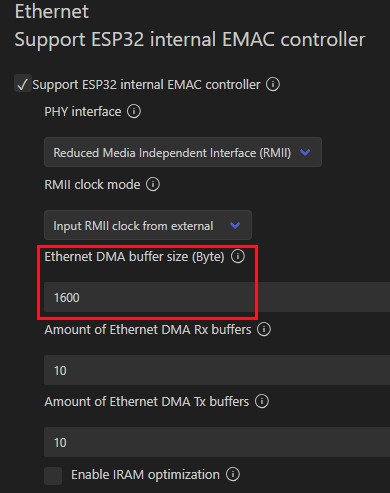
- Ethernet - Ethernet DMA buffer size: Increase for higher troughput (max is 1600).
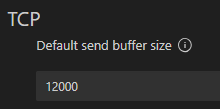
- Ethernet - Default send buffer size: If mode "Transmit All" is used, the Default Send Buffer Size must be large enough to fit the Internal Buffer Size. If mode "Transmit Chunks" is used, the Default Send Buffer Size only needs to be large enough for a single chunk (Chunk Size).
- LwIP - Enable LwIP stack Enable this and other LwIP settings needed for TCP/IP communication.
- LwIP - Enable tcpip core locking: Enabled
Make sure to increase the stack size for Trace Control Task to 512 (or higher). Otherwise you are likely to get stack overflows causing cryptic crashes.
Also make sure to enable the Internal Buffer. You can adjust the Internal buffer size to balance maximal throughput and memory usage.
Ensure the TCP send buffer is larger than the TraceRecorder buffer to avoid issues with failed sends.
To record a trace via TCP, first ensure the project has been built and flashed without errors. Start the device and wait until you see that the device has received an IP address.
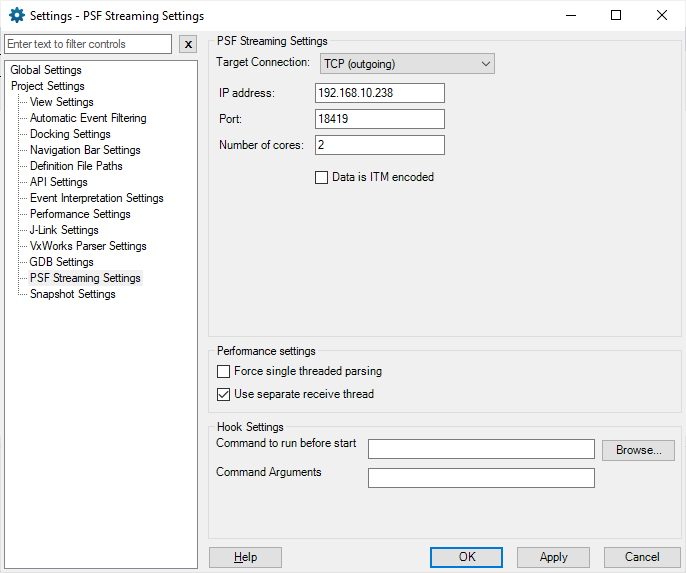
In Tracealyzer, open File > Settings > PSF Streaming Settings.
- Target Connection: TCP (outgoing)
- IP address: The IP address of the device
- Port: The device TCP port. It is recommended to use the default port 18419.
- Number of cores: The number of processor cores (1 or 2 depending on your ESP32 variant).
Select Trace > Open Live Stream Tool. Check the checkbox "Disable live visualization" to begin with.
Click "Connect" and "Start Session".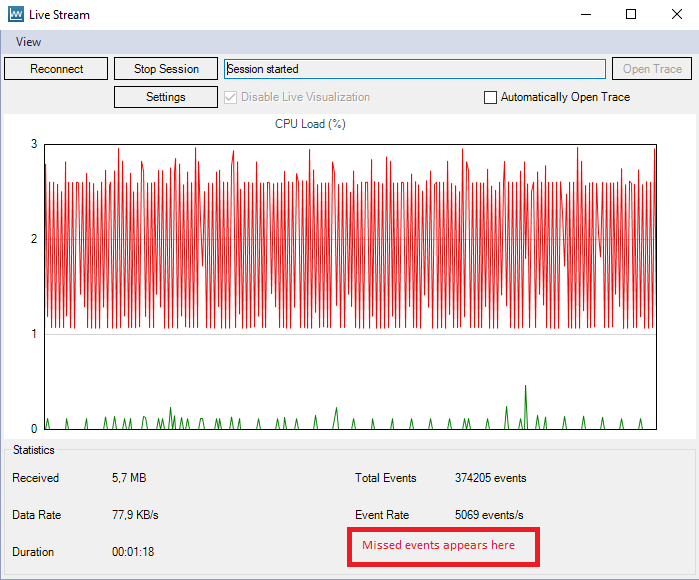
Check that Event Rate jumps from zero to a non-zero value. If not, please refer to the Troubleshooting section.
Also check if a Missed Events counter appear in the lower right corner of the Live Stream Statistics panel. If so, please refer to the Troubleshooting section.
Select Stop Session when satisfied with the trace to enable all views and features.
If you don't have any missed events, or very few, try enabling Live visualization by unchecking the "Disable live visualization" checkbox.
Note that live visualization puts additional load on the computer and may contribute to missed events, that may cause incorrect display. -
Streamport "UDP"
The UDP streamport transfers the trace data via UDP. This is sometimes faster and more lightweight than TCP transfer, but can be less reliable.
On multicore systems, TraceRecorder creates one socket for each core, using the assigned port as a base and then +1 for each core. For example, for a dual core system where port 18419 is set it will use 18419 and 18420.ESP-IDF Configuration for UDP
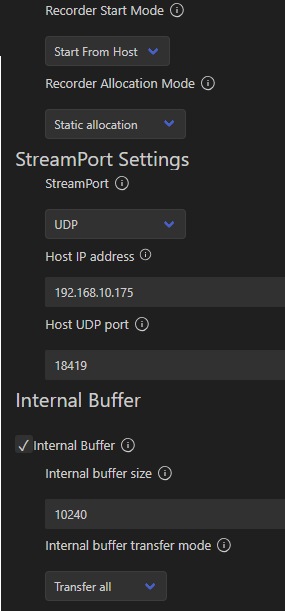
- Percepio TraceRecorder - Recorder Start Mode: "Start From Host" is recommended, meaning the tracing begins when a start command is received from the host application.
- StreamPort Settings - StreamPort: UDP
- StreamPort Settings - Host IP address: The IP address of your host computer.
- StreamPort Settings - Host UDP port: The UDP port where the host application is expecting the trace data. It is recommended to use the default value 18419 if possible.
- Internal Buffer - Internal buffer: Enabled
- Internal Buffer - Internal buffer size: 10 - 16 KB is recommended to begin with, but depends on system event rate. Adjust as needed to minimize missed events and memory usage.
- Internal Buffer - Internal buffer transfer mode: "Transfer All" is recommended in most cases.
- Trace Control Task - Control Task Stack Size: 512 is recommended (256 not enough)
- Ethernet - Ethernet DMA buffer size: Increase for higher troughput (max is 1600).
- LwIP - Enable LwIP stack Enable this and anything else needed for the UDP communication.
Make sure to increase the stack size for Trace Control Task to 512 (or higher). Otherwise you are likely to get stack overflows causing cryptic crashes.
Also make sure to enable the Internal Buffer. You may adjust the Internal buffer size to balance maximal throughput and memory usage.
To record a trace via UDP, first ensure the project has been built and flashed without errors. Start the device and wait until you see that the device has received an IP address.
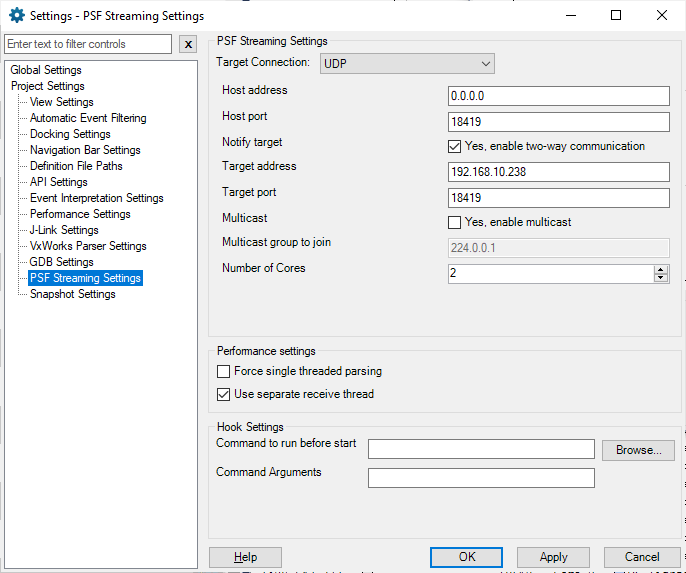
In Tracealyzer, open File > Settings > PSF Streaming Settings.
- Target Connection: UDP
- Host address: The IP address of your host system. This can usually be left as 0.0.0.0, but can be specified to force Tracealyzer to communicate using a specific network interface.
- Host port: The host UDP port. It is recommended to use the default port 18419. If changed, make sure this matches "Host UDP port" in the ESP-IDF settings.
- Notify target: Checked (needed when using "Start from Host")
- Target address: The IP address of your ESP32 device.
- Target port: The UDP port number of TraceRecorder on your ESP32 device, to where the start/stop commands are sent. It is recommended to use the default port 18419.
- Number of cores: The number of processor cores (1 or 2 depending on your ESP32 variant)
Select Trace > Open Live Stream Tool. Check the checkbox "Disable live visualization" to begin with.
Click "Connect" and "Start Session".
Check that Event Rate jumps from zero to a non-zero value. If not, please refer to the Troubleshooting section.
Also check if a Missed Events counter appear in the lower right corner of the Live Stream Statistics panel. If so, please refer to the Troubleshooting section.
Select Stop Session when satisfied with the trace to enable all views and features.
If you don't have any missed events, or very few, try enabling Live visualization by unchecking the "Disable live visualization" checkbox.
Note that live visualization puts additional load on the computer and may contribute to missed events, that may cause incorrect display. -
Streamport "ESP-IDF AppTrace"
This streamport uses the ESP-IDF AppTrace library to stream the trace data over the debug connection to OpenOCD, using the Trax interface.
ESP-IDF Configuration for AppTrace
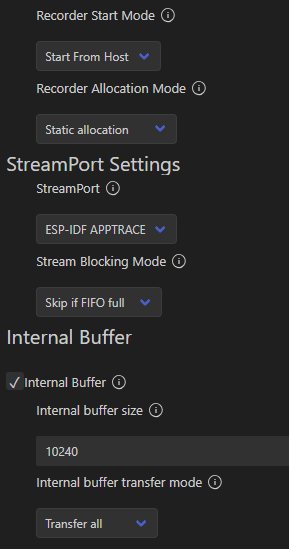
- Percepio TraceRecorder - Recorder Start Mode: "Start" or "Start From Host". With "Start" the tracing begins right at startup. With "Start from host", the tracing begins when a start command is received from the host application.
- StreamPort Settings - StreamPort: ESP-IDF APPTRACE
- Internal Buffer - Internal buffer: Enabled
- Internal Buffer - Internal buffer size: 10 - 16 KB is recommended to begin with, but depends on system event rate. Adjust as needed to minimize missed events and memory usage.
- Internal Buffer - Internal buffer transfer mode: "Transfer All" is recommended for buffer sizes up to 16 KB, otherwise "Transfer Chunks" and set the Chunk Size to be at most 16384 (or an even divisor like 2048 or 4096).
- Trace Control Task - Control Task Stack Size: 256 (default)
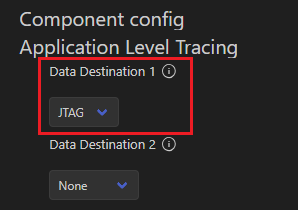
- Component Config, Application Level Tracing - Data Destination 1: JTAG
- Component Config, Application Level Tracing - Data Destination 2: None
-
Open Percepio Tracealyzer and select File -> Settings -> PSF Streaming Settings, and choose Target Connection: GDB.
-
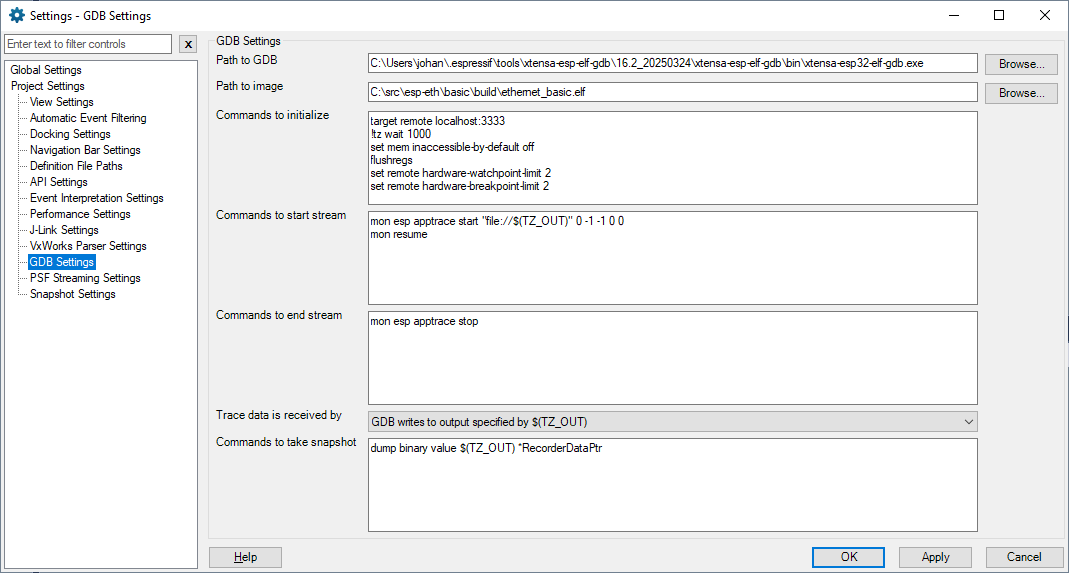
Navigate to GDB Settings.
-
Set Path to GDB to the GDB executable provided by Espressif (xtensa-esp32-elf-gdb.exe). This is typically found in the .espressif folder in the home directory, for example
C:\Users\<USER>\.espressif\tools\xtensa-esp-elf-gdb\16.2_20250324\xtensa-esp-elf-gdb\bin\xtensa-esp32-elf-gdb.exe. -
Set Path to Image to the .elf file from your build.
-
Configure Commands to Initialize as follows:
target remote localhost:3333
!tz wait 1000
set mem inaccessible-by-default off
flushregs
set remote hardware-watchpoint-limit 2
set remote hardware-breakpoint-limit 2
-
Configure Commands to Start Stream:
-
Enter the following command:
mon esp apptrace start "file://$(TZ_OUT)" 0 -1 -1 0 0
mon resume
-
If using Start Option "Start", you may need to add "mon reset halt" as the first command. This restarts the system so you can catch the whole trace from the very beginning.
mon reset halt
mon esp apptrace start "file://$(TZ_OUT)" 0 -1 -1 0 0
mon resume
-
-
Configure Commands to End Stream as follows:
mon esp apptrace stop
-
Set Trace Data is Received by to GDB Writes Data to Output Specified by $(TZ_OUT)
-
To enable using the ESP-IDF debugger and Tracealyzer streaming at the same time, we need to make a small change in the OpenOCD configuration file for your board.
-
Open <User Home Directory>/.espressif/tools/openocd-esp32/<esp-idf_version>/openocd-esp32/share/openocd/scripts/target/<board>.cfg, for example esp32s2.cfg
-
Add the following:
$_TARGETNAME_0 configure -gdb-max-connections 3just beforesource [find target/xtensa-core-esp32s2.cfg].
-
-
To record a trace via AppTrace, first ensure the project has been built and flashed without errors. Start the ESP-IDF Monitor and verify it is connected to the device.
-
In Tracealyzer, select Trace -> Open Live Stream Tool. Check the checkbox "Disable live visualization" to begin with. Click "Connect" and "Start Session". Check that Event Rate becomes a non-zero value. Note that it might take around 3-5 seconds before the data reaches Tracealyzer.
When satisfied with the trace, select Stop Session. This will loaded the trace data into the main Tracealyzer interface.
Check if a Missed Events counter appear in the lower right corner of the Live Stream Statistics panel. If so, please refer to the Troubleshooting section.
If you don't have any missed events, or very few, try enabling Live visualization by unchecking the "Disable live visualization" checkbox. However, note that live visualization puts additional load on the computer and may contribute to missed events and incorrect display.
If you see an error about
E (xxxx) esp_apptrace: Trace destination 1 not supported!make sure to set "Data Destination 1" to "JTAG" in Application Level Trace settings.
Other Options
The following settings are general for all streamports and good to be aware of.
Troubleshooting and optimization
The ESP-IDF menuconfig system provide several options useful for troubleshooting and optimization of the TraceRecorder setup. Apart from the streamport-specific settings, the following common settings are also available for TraceRecorder in ESP-IDF.
- Entry Table Slots: How many named objects to allocate space for, including tasks, explicitly traced ISRs, named kernel objects and user event channels.
- Trace Coverage: What types of events to include. It is recommended to include "Trace Task Ready Events" since required for separating tasks into "instances" (jobs).
- Stack Monitor: Enable this to record the amount for free stack per task, displayed in the Stack Usage view.
- Control Task Priority: TraceRecorder adds a periodic task, that appears as TzCtrl in the trace. This is used for data transfer when using the Internal Buffer option (it flushes the buffer to the streamport interface) and also runs the Stack Monitor checks periodically. It is adviced to run this on low scheduling priority to minimize overhead.
- Control Task Delay: The delay time for the Control Task (TzCtrl, see above), which affects the frequency of Internal Buffer flushes in TCP, UDP and AppTrace streaming. The shorter delay, the higher throughput is possible. To allow for using very short delays, you may need to increase the RTOS tick rate (configTICK_RATE_HZ). It also affects the frequency of Stack Monitor checks.
Task names not displayed
If task names are missing and replaced by hexadecimal addresses, this is usually because the "Entry Table" in TraceRecorder had too few slots and became full. This table stores object metadata, such as names. In that case, the menuconfig Entry Table menu allows for adjusting the number of slots. Make sure this is enough to cover the total number of objects in the trace, such as tasks and explicitly traced ISRs.
User Events not diplayed correctly
Tracealyzer offers integrated logging support, a.k.a. User Event Logging, that is very useful for debugging purposes.
If user event logging (e.g. xTracePrintF() calls) doesn't appear as expected, this is most likely due to insufficient Entry Table slots. See above.
If you experience crashes when using TCPIP or UDP tracing, make sure "Enable tcpip core locking" is checked in the ESP-IDF settings for LwIP. In particular we have noted crashes when stopping the tracing session and closing the lwIP sockets. Another reason for crashed is too small stack size for the Trace Control Task. This is configurable as "Control Task Priority" in the ESP-IDF menuconfig settings. The default value (256) is too small for TCP/IP or UDP trace streaming. 512 is a suitable level for TCP/IP or UDP that gives some margin.
Note that kernel objects such as semaphores does not have names by default, but can be named using the TraceRecorder API.
Missed events during trace streaming
During live streaming, if the software event rate is higher than the maximum throughput for some time, some events might be lost.
This is labeled as "Missed events" in Tracealyzer and may result in incorrect display.
We don't recommend trusting the Tracealyzer views after missed events have been observed.
Missed events are shown in two ways, as a counter in the Live Stream statistics panel, and as sections with red background in the trace view.

To minimize missed events, improve the throughput by reducing the Control Task Delay setting so TzCtrl runs more frequently, and/or try increasing the internal buffer size.
To allow for using very short delays, you may need to increase the FreeRTOS tick rate (configTICK_RATE_HZ), e.g. from 100 Hz to 1000 Hz.
If you see that the TzCtrl task isn't allowed to execute sufficiently due to higher priority tasks using too much processor time, consider increasing Control Task Priority.
This can improve troughput, but at the expense of other threads now having to wait for TzCtrl to finish.
Data is received, but can't open the trace.
After starting a trace session, make sure the Event Rate counter in the Live Stream window is non-zero and updating frequently (every 2-3 seconds). If Data Rata is non-zero but Event Rate remain at zero, it means Tracealyzer missed the initial part of the trace and can't resynchronize. This may occur if TraceRecorder sends a too large data chunk so the underlying streamport interface (e.g. AppTrace) fails to send it. For the AppTrace (Trax) interface, at most 16 KB can be written at a time due to the 16 KB Trax buffer size. To exceed 16 KB buffer size (16384), you need to set "Internal buffer transfer mode" to "Transfer Chunks". For efficiency reasons the chunk size should be a divisor of the 16 KB TRAX buffer size, for example 2048, 4096, 8192 or at most 16384. Consider increasing "Immediate re-transfer count limit" to allow more chunks to be transmitted without delay.
If using TCP streaming, it seems the maximum send size is decided by the "Default send buffer size" setting in ESP-IDF. The Internal Buffer size should not exceed these limits, unless using the If using "Transmit Chunks" mode where the limitation instead applies to the chunk size.
Bandwidth Limitations and Solutions
Note that ESP-IDF AppTrace streaming offers limited throughtput, up to about 300 KB/s with the default settings.
It is possible to reach a bit over 400 KB/s if using a large enough Internal Event Buffer and a short enough Control Task Delay.
If your application produces more trace data than AppTrace can handle, you can reduce the traced events via the Trace Coverage settings in ESP-IDF.
You may safely exclude OS Tick events, but it is advised to keep Task Ready Events, since needed for proper task visualization and metrics.
You can minimize the event rate by enabling "Only Record Scheduling Events". This excludes all other kernel events, such as mutex and semaphore events.
To increase the troughput further, consider increasing the JTAG speed. This is defined in the OpenOCD .cfg file for your debug interface. These can be found at USER\.espressif\tools\openocd-esp32\v[VERSION]\openocd-esp32\share\openocd\scripts. First locate the .cfg for your board, such as esp32-ethernet-kit-3.3v.cfg. This refers to "interface/ftdi/esp_ftdi.cfg" that contains "adapter speed 20000", together with a comment that reveals it can go as high as 26000.
Alternatively use Ethernet-based tracing (TCP/IP or UDP) that enables higher throughput. Over 1 MB/s and close to 2 MB/s is possible, depending on configuration.
For higher throughput over Ethernet, consider increasing the "Ethernet DMA buffer size" (max is 1600) and "Amount of Ethernet DMA Tz Buffers".
Questions?
If have questions or encounter some technical issue, contact Percepio here.
Copyright (c) Percepio AB, 2025