Tracealyzer for OpenVX – Synopsys EV6x
Today’s powerful vision processors and GPUs allow for great performance, but how do you ensure your solution really makes efficient use of the hardware? Perhaps some node requires much more processing time than expected and overloads a core, while the other cores are mostly idle? Perhaps the application is spending a lot of time waiting for DMA transfers to complete? Perhaps you have tried to improve performance by adding more compute resources, but the performance gain is less than expected? Fixing bottlenecks like these may yield vast improvements in performance, often with only small changes. This requires good insight into the runtime system.


Percepio Tracealyzer for OpenVX allows you to visualize the execution of OpenVX applications and identify bottlenecks where optimization can make a big difference. Tracealyzer for OpenVX is initially available for Synopsys EV6x embedded vision processors, leveraging the built-in trace support in Synopsys ARC® MetaWare EV Development Toolkit.
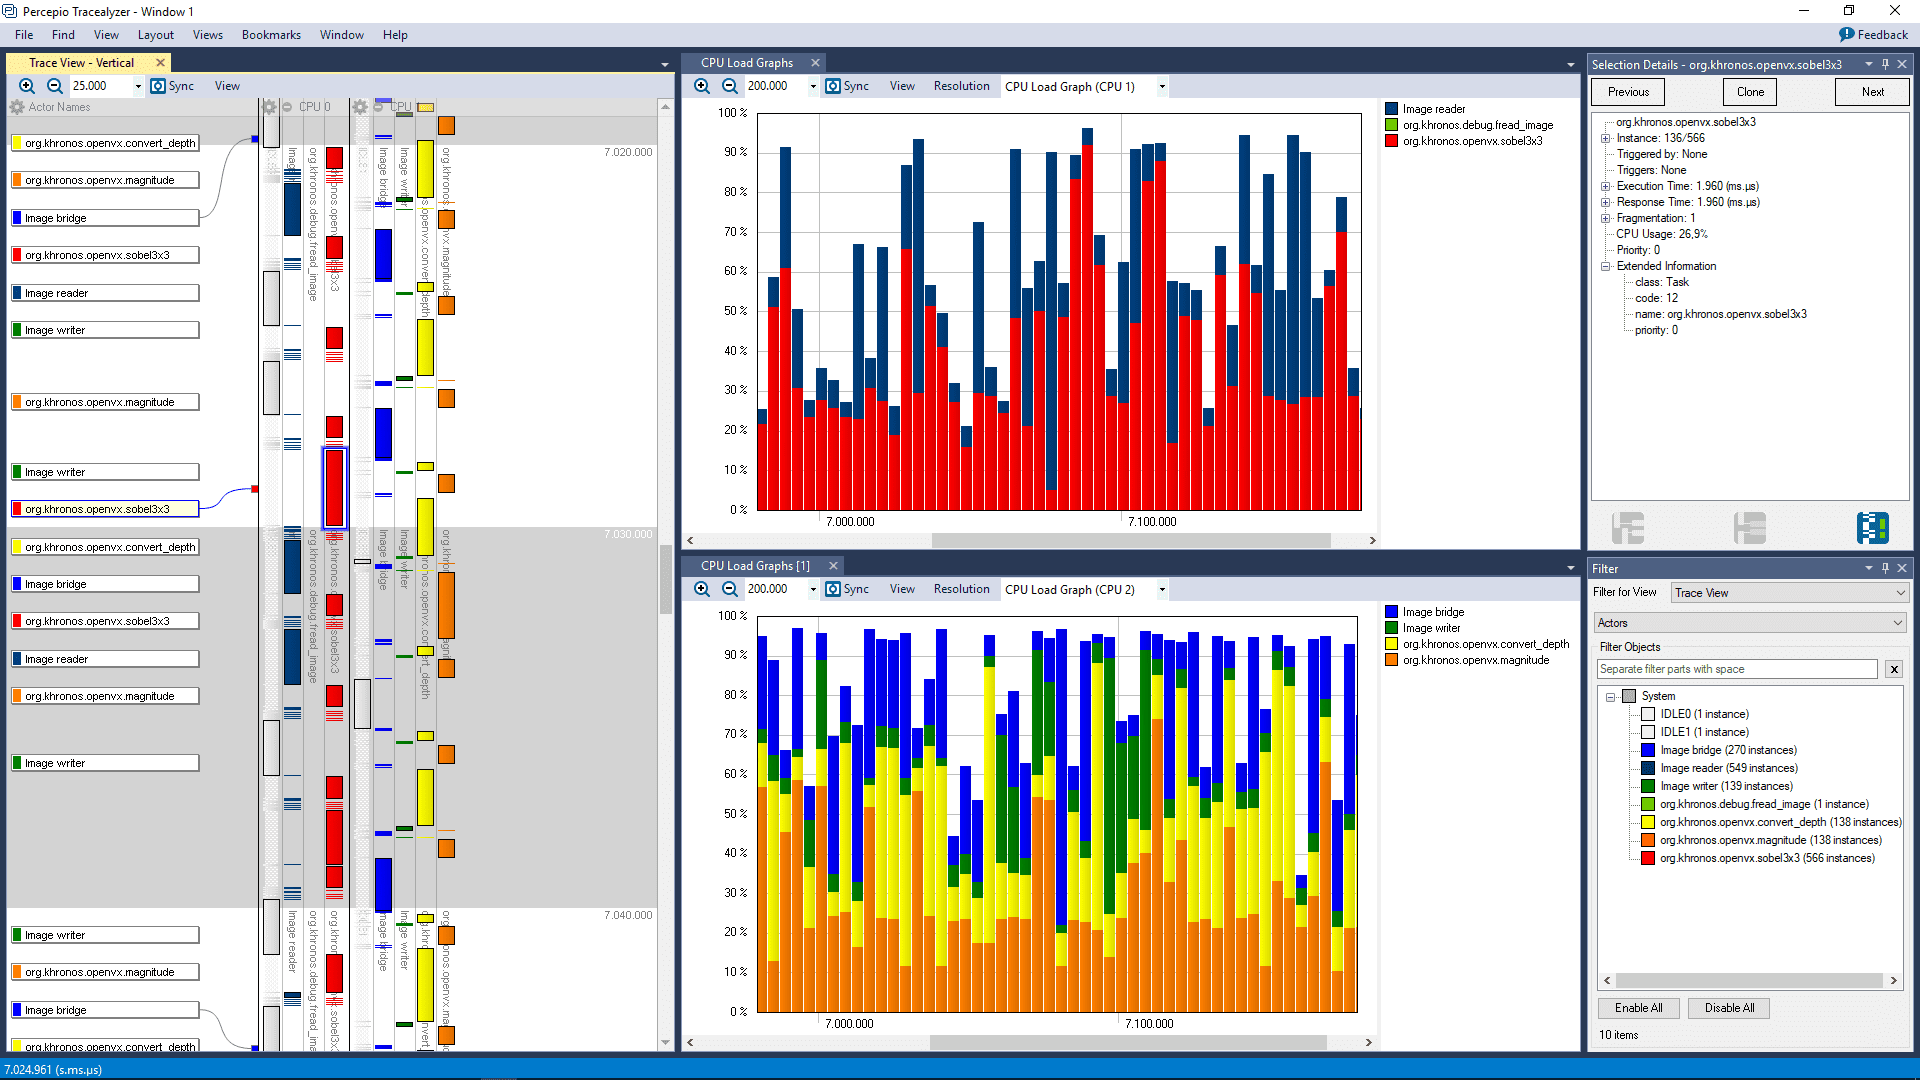
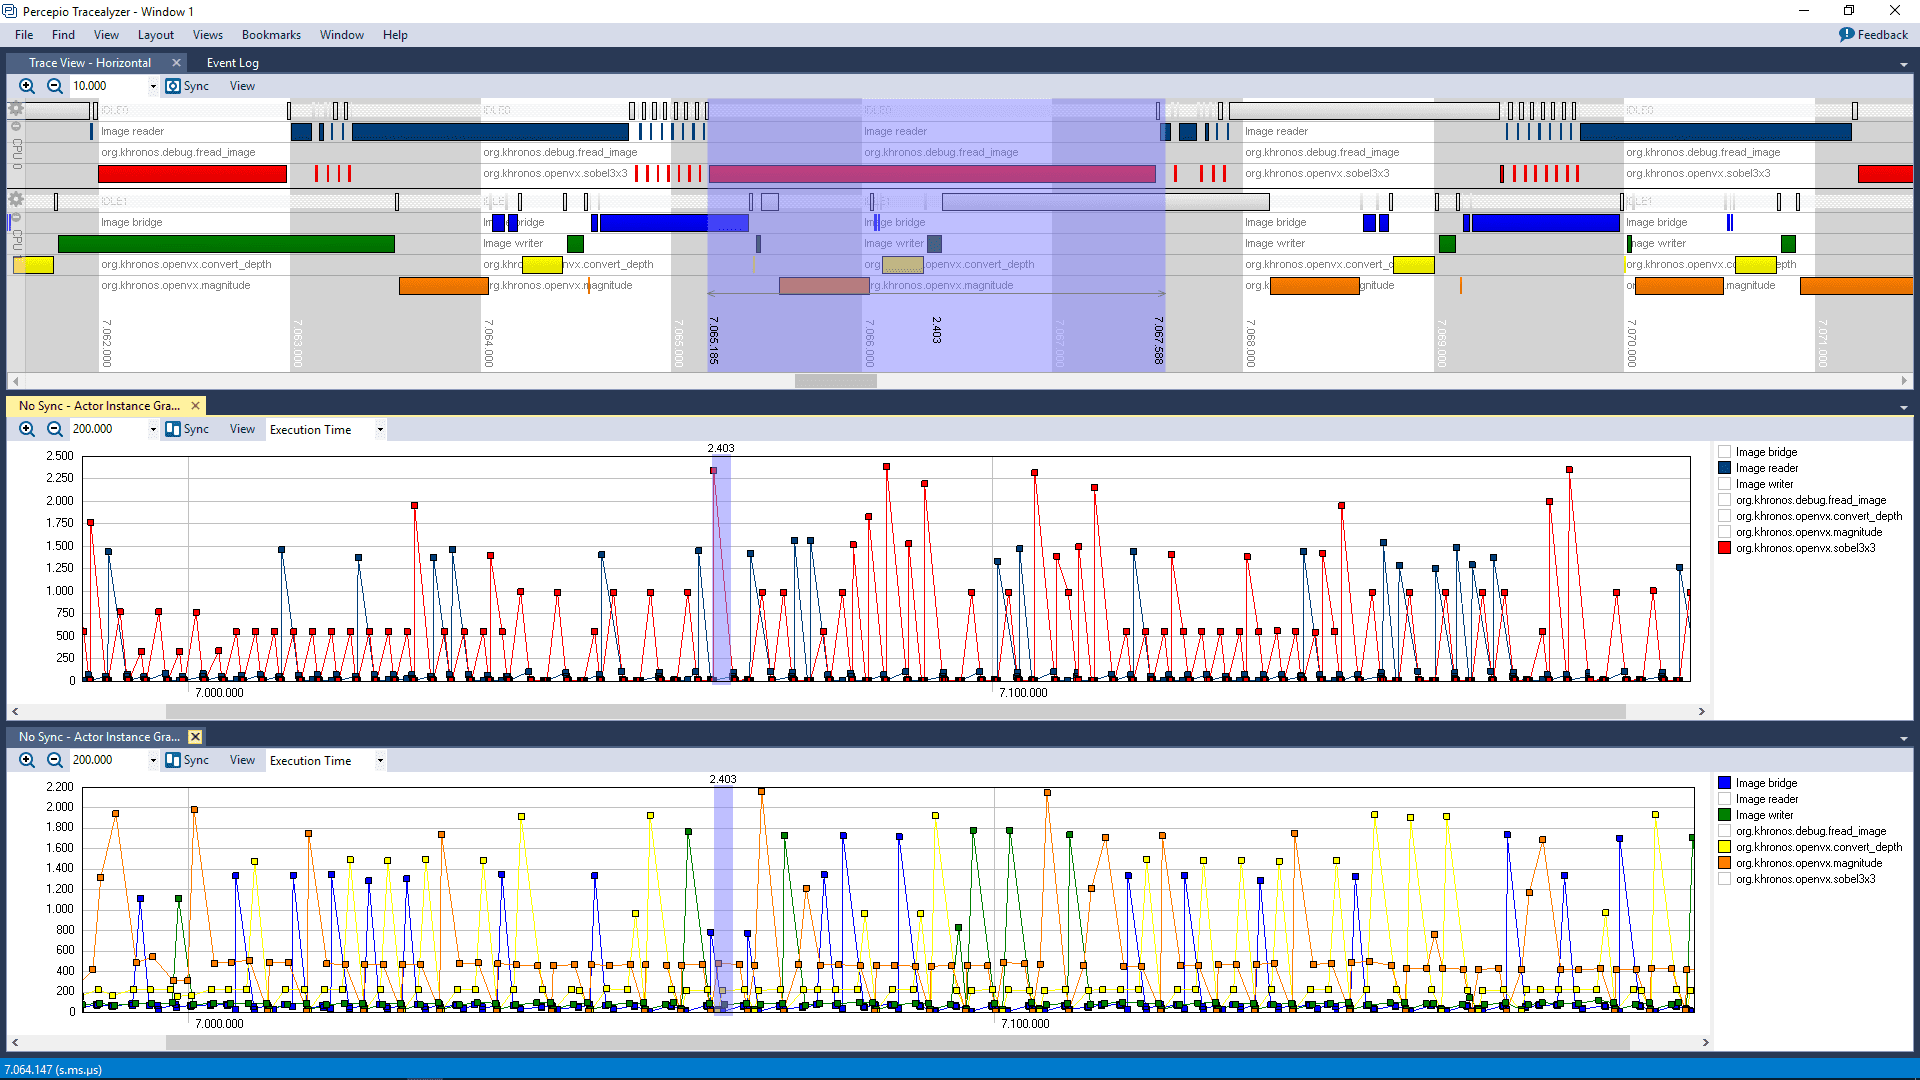
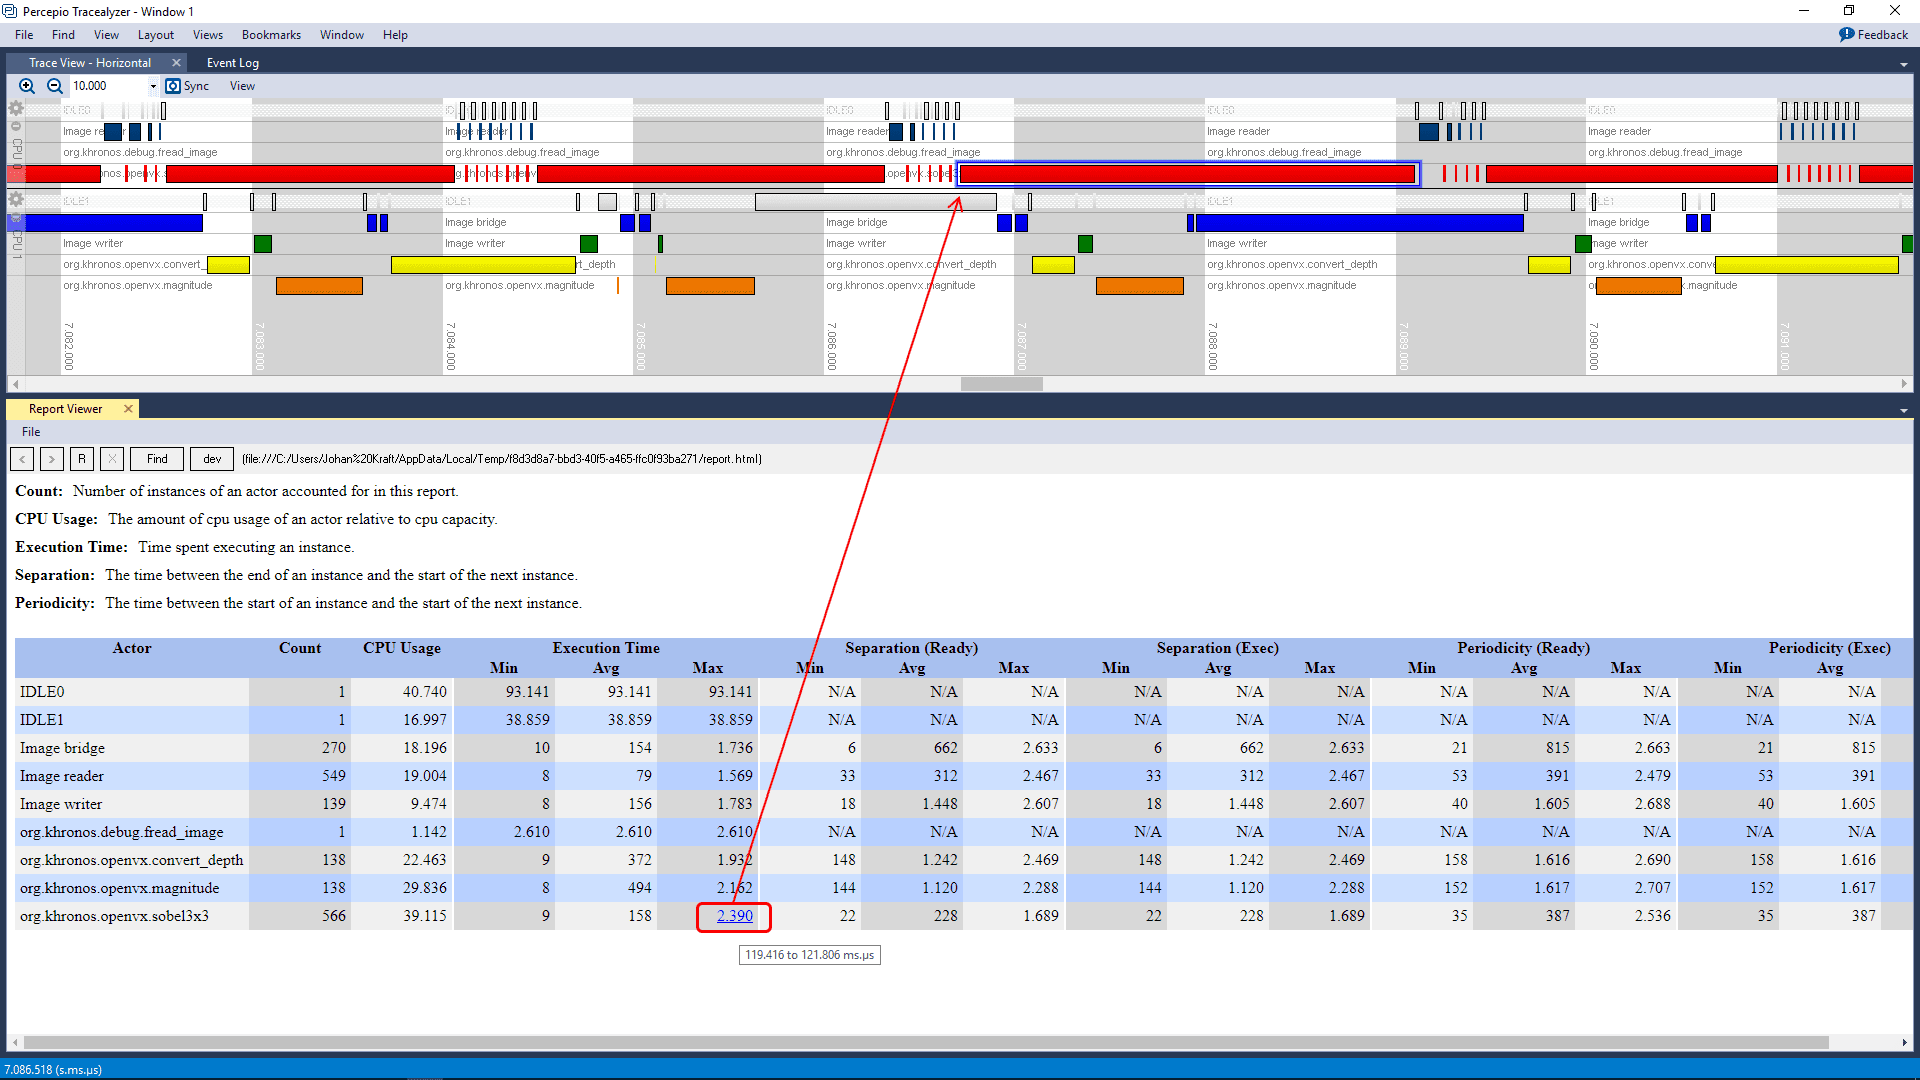
Tracealyzer for OpenVX provides a variety of graphical views showing different perspectives of the recorded behavior, ranging from a detailed trace view to high-level overviews and statistics. The trace view, shown on the left side in the screenshot above, displays a timeline of the OpenVX graph execution on the available cores and accelerators, so you can to study the scheduling, pipelining and timing in great detail. The trace view can be adapted in many ways and supports both horizontal and vertical display.
In the center part of the screenshot you see two instances of Tracealyzer’s CPU Load Graph, showing how the processor cores are utilized by the application. This way, you can see not only the overall load, but also how the load varies over time, and how much processing time that is used by each graph node. It also serves an an overview of the trace where you can spot anomalies. You can for instance see two significant spikes in the ”sobel3x3” node (shown in red). To see what causes them, you can simply double-click in the CPU Load Graph to show the corresponding section in the trace view. All views in Tracealyzer are interconnected in similar ways, which makes it easy to drill down from high-level overviews into the detailed trace. The colors are used to make it easier to identify the OpenVX graph nodes. The same color coding is used across all Tracealyzer views.
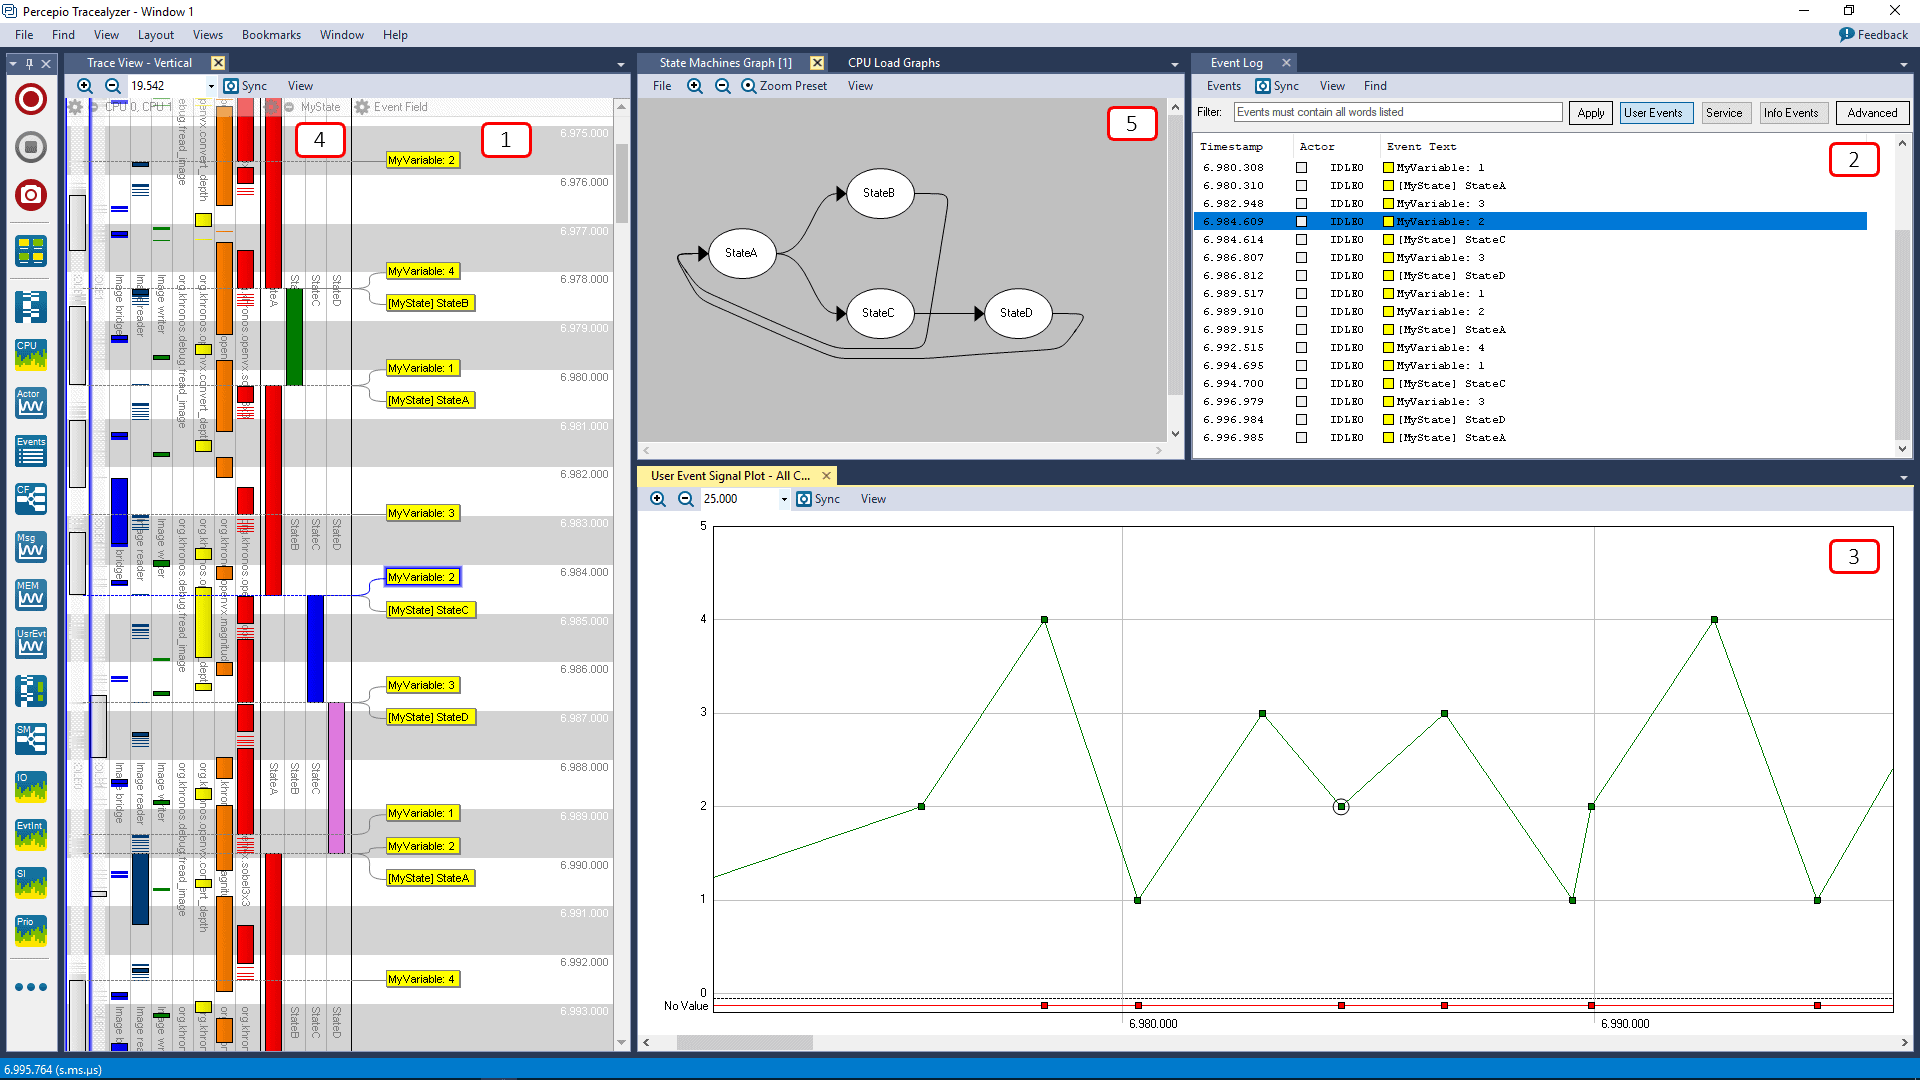
The trace view can also show user events, i.e. custom events logged by the application developer. User events allows you to visualize just about anything in your application, like diagnostic messages, variable values and states. In the screenshot above, we see an example where user events have been logged on two user event channels: ”MyVariable” showing values of an integer variable and ”MyState” showing state names. Tracealyzer can display such user events in several ways, e.g. as event labels in the trace view (1) and as entries in the Event Log (2). The User Event Signal Plot (3) allows for plotting numerical data from user events.
Moreover, if you have important state variables in your system, you can log the state changes as user events and define a State Machine in Tracealyzer to see the states in the trace view timeline (4). You can also see a summary of the state changes as a state machine graph (5). You can even get statistics on the time spent in each state, or the time between any two events, by defining a custom interval.
Tracealyzer is a powerful and integrated toolbox for trace visualization and analysis, with many more features and options than mentioned here. It supports several software platforms, not just OpenVX and vision processing but also general RTOS- and Linux-based systems.
Getting Started
Percepio Application Note PA-025 describes how to get started with Tracealyzer for OpenVX, using Synopsys EV6x processors and Synopsys MetaWare EV Development Toolkit.
In case you have questions, feel free to contact support@percepio.com.
Stay informed.
Sign up for our newsletter.
Our Products
Percepio® is the leading provider of visual trace diagnostics for embedded and IoT software systems in development and in the field.
TRACEALYZER
Percepio® Tracealyzer combines software tracing with powerful visualizations, allowing users to spot and analyze issues in software recordings during development and testing.
DEVALERT
Percepio® DevAlert is a cloud-connected monitoring framework for OEMs developing RTOS device software, providing instant insight on bugs and anomalies.


