Percepio Tracealyzer®
Visual trace observability for “X-ray vision” in your embedded software development.
Speed up everyday debugging, solve issues and deliver great products on time.
Simplify Debugging and Develop Faster
“Tracealyzer has doubled our development speed. Problems that would take days to solve are obvious with this tool and just a quick fix. We use it all the time.” — Alex Pabouctisids, Lead Firmware Engineer, Flyability
Fed up with endless hours debugging embedded C/C++ code? Bid farewell to tedious troubleshooting and welcome accelerated development with Percepio Tracealyzer. Traditional debugging is often ineffective for today's complex RTOS or Linux systems and may consume 40-50% of the development time.
Get visual trace observability to speed up your everyday debugging and solve issues where traditional debugging falls short. Learn how Tracealyzer simplifies debugging.

Optimize System Performance
“In less than 5 days from running the tool, we improved the performance of our graphic rendering engine by 3x” - Terry West, CEO, Serious Integrated, Inc.
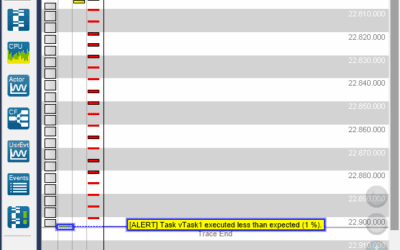
Tracealyzer offers advanced profiling features showing the events behind the numbers. Pinpoint performance bottlenecks and unlock the full potential of your hardware. Ensure you meet product performance goals and deliver a responsive user experience.
Optimization is challenging for multi-threaded RTOS or Linux systems. When a thread is slow, it is often due to factors not apparent in the source code. Visual trace observability gives the full picture and simplifies optimization.

Watch the Brief Introduction (2 min)
How it Works – From Events to Insight
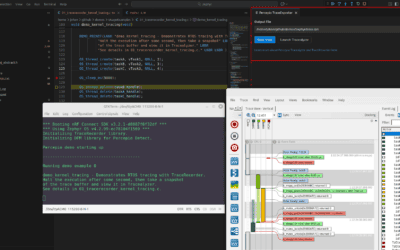
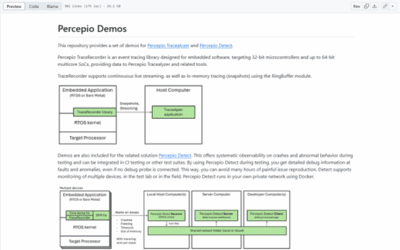
Percepio Tracealyzer visualizes the behavior and timing of embedded software based on a software tracing library added in the target system. This extends your RTOS kernel with lightweight instrumentation added to preexisting hooks to capture key events, such as task switching, kernel API calls, blocking, timeouts and more. There is also a C API for custom logging (“user events”) that lets you extend the tracing to log variable values and other debug events.
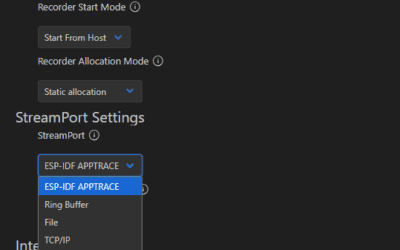
The trace can be explored visually in Tracealyzer using various graphical views and analytics for debugging, profiling and anomaly detection, including CPU load graphs, stack and heap memory usage, and timing plots. Tracing can run as continuous live streaming or as in-memory snapshots to capture critical moments leading up to a problem.
Tracealyzer is a 100% software solution and does not require a trace port on your device, but can nonetheless benefit from fast debug probes such as IAR I-Jet and Segger J-Link as high-speed interfaces for continuous trace streaming.

User Testimonals


Bare-metal, RTOS and Linux
Tracealyzer provides prepackaged support for many popular embedded operating systems and RTOS kernels, including FreeRTOS, Zephyr, ThreadX, PX5 RTOS, SafeRTOS, LynxOS-178, VxWorks and Linux. The Tracealyzer SDK enables other OS integrations and also extensions for full-stack observability. The Bare-Metal option can be used in any C/C++ project, with or without a supported RTOS kernel.
On any processor
Tracealyzer supports many processor families, including STM32, NXP i.MX RT, Xilinx Zynq and other Arm devices, ESP32 and others. Tracealyzer is commonly used on 32-bit microcontrollers, 64-bit multicore SoCs and everything in between.


With any development tools
Tracealyzer can be used with any compiler, including GCC, Clang and IAR Embedded Workbench. Specific guides and debugger support are available for Arm Keil µVision, IAR, Segger J-Link, STM32CubeIDE, Espressif ESP-IDF and Lauterbach.
Learn More
There are plenty of articles and customer cases in our blog and in the Resources section. In particular, make sure to read the white paper Stop Guessing and also check out Tracealyzer Hands On, a series of short blogs on practical examples of Tracealyzer.

")
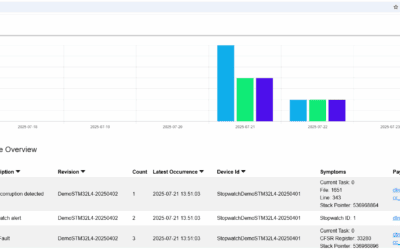
Continous Observability with Percepio DevAlert
Percepio also provides a cloud-connected solution for continuous observability in system testing, field testing and in deployment, Percepio DevAlert. This includes Tracealyzer support as well as remote debugging support on source-code level, for example on hard fault exceptions.
“Tracealyzer has always offered exceptional value to our global community of users by giving engineers direct insight into how their applications are executing. This information is invaluable when both optimizing and debugging FreeRTOS applications.”
“Percepio Tracealyzer enables unparalleled insight into the execution and timing of the RTX5 real-time operating system, the MDK middleware components and the user application. Percepio is the first ARM partner to utilize our new Event Recorder technology, which provides high-speed access to a running target system.”
“What Percepio has achieved with Tracealyzer is to remove the guesswork of designing an RTOS-based system. It’s ability to record and then analyze what’s happening gives developers a view into their system that would be impossible to have otherwise.”
“It’s nearly impossible for developers to correct a safety, security, or performance issue if they can’t see or understand the problem. Percepio’s Tracealyzer provides extensive firmware visualization, which fosters a better understanding of the firmware. Developers using Tracealyzer on the PX5 RTOS platform can more easily enhance and optimize their firmware and swiftly debug issues, including the most difficult system crashes.”