
Percepio Detect™
Catch Elusive Bugs in CI/CT Pipelines dan Field Testing. Skip the Painful Reproduction.
Catch Elusive Issues Early. Skip the Painful Reproduction. Debug with Ease.
Percepio Detect™ brings Continuous Observability® to your RTOS-based systems, focusing on crashes and stability risks during automated IoT software testing. Designed for seamless integration into your in-house testing setups, CI/CT pipelines, and field trials, Detect helps development teams identify and resolve issues early – long before they reach production.
With Detect, you capture detailed insights at the very first sign of trouble, speeding up debugging and removing the need for manual issue reproduction. Acting as a software-only “security camera” for your firmware, it records sporadic, hard-to-reproduce anomalies – such as race conditions, deadlocks, and watchdog resets – as they happen, turning complex troubleshooting into straightforward fixes.
Percepio Detect™ also reveals hidden stability risks, including “near misses” and timing anomalies caused by multithreading issues that would otherwise go unnoticed. By monitoring software timing and resource usage, you can define warning thresholds and receive instant, detailed insight into anomalies – helping you understand not just what happened at the system level, but why.
Why Engineering Teams Choose Percepio Detect™
- Capture crashes and risks in real time for systematic visibility across all test devices.
- Debug faster with automatic crash dumps and system traces captured at the exact millisecond of failure.
- Reduce debugging time by up to 90% by eliminating the need to reproduce intermittent bugs.
- Monitor your system over unlimited time without high-bandwidth trace streaming overhead.
- Detect timing and multithreading issues like deadlocks, thread starvation, and priority inversions.
- Integrates into CI/CT workflows and automated test benches without requiring a hardware probe or changes to your existing build configuration.
- Private on-premise server (Docker package) for full control over sensitive data and IP.
How Percepio Detect™ Compares to Traditional Debugging Methods
| Capability | Traditional Debugging (GDB / Breakpoints) | Hardware Trace Probes (J-Link / I-Jet) | Percepio Detect™ (Continuous Observability) |
|---|---|---|---|
| Suitability for CI/CT | No. Requires manual interaction and halts execution. | No. Requires physical connection to expensive hardware probes. | Yes. 100% software-only, automated trigger system. |
| Field Testing Viability | No. Cannot attach debuggers to devices in the field. | No. Probes cannot be deployed on customer sites. | Yes. Runs on-target, storing alerts locally during offline trials. |
| Data Overhead | Low, but halts the system. | Extremely high. Requires continuous high-bandwidth streaming. | Minimal. Only captures and stores data when an anomaly triggers. |
| Diagnostic Depth | Static register state at the moment of halt. | Full execution trace (requires physical hardware). | Layered. Combines optimized core dumps with visual event traces. |
| Data Privacy | Local, but manual. | Local, but manual. | Full Control. On-premise package on your private server. |
Seamless Compatibility with Your Existing Toolchain
Designed to fit seamlessly into your existing hardware and software environments, Percepio Detect™ requires no proprietary hardware or external probe hardware.
- Adaptable to RTOS & OS: FreeRTOS, Zephyr Project, Eclipse ThreadX, SafeRTOS, PX5 RTOS, VxWorks, and Embedded Linux.
- Supported Architectures: Arm Cortex-M (M0, M3, M4, M7, M33) and Cortex-A, STM32, ESP32, and NXP i.MX RT.
- Supported IDEs & Compilers: IAR Embedded Workbench (with SWO/ITM data logging support) and GCC.
- Deployment: On-premise servers, ensuring complete data privacy and IP control.
Percepio Detect™ in Practice
Scenario 1: Automated IoT device testing in CI/CT pipelines
- The Setup: An ESP32-based smart gateway running FreeRTOS undergoing automated overnight integration testing.
- The Pain: The gateway occasionally freezes during stress testing. Because it is headless and mounted in a remote test rack, attaching a physical debugger is impossible, and power-cycling the device to recover it erases the RAM.
- The Mechanism: Percepio Detect™ is integrated into the test build. Its TaskMonitor feature is configured to track CPU usage per task. During the test, TaskMonitor detects that the main communication thread has dropped to 0% CPU due to a deadlock on a socket mutex.
- The Outcome: Detect automatically triggers, capturing a 3 KB Tracealyzer trace of the last 142 events and an optimized 332-byte core dump of the stack. The alert is sent to the shared team dashboard. The developer opens the trace in Tracealyzer, identifies the exact sequence of mutex acquisitions, and fixes the deadlock in minutes.
Scenario 2: Long-term field testing and beta trials
- The Setup: An industrial robotics controller running Zephyr on an Arm Cortex-M33 microcontroller.
- The Pain: During beta trials at a customer site, the controller occasionally triggers a watchdog reset. The issue is highly intermittent, occurring only once every few weeks under specific load conditions.
- The Mechanism: Percepio Detect™ runs on-target in the field. It utilizes the ArmV8-M hardware stack limit checking (PSPLIM/MSPLIM) to monitor for stack overflows. When a stack overflow triggers a UsageFault exception, Detect’s optimized CrashCatcher implementation safely intercepts the exception, bypasses the hardware limit loop, and saves a minimal core dump directly to the device’s flash memory.
- The Outcome: Upon the next restart, the device uploads the alert and core dump to the private on-premise server. The engineering team inspects the call stack and function arguments in GDB, identifying a deeply nested recursive function call under high network load.
Collaborative Debugging and Automated IoT Software Testing
Percepio Detect™ is built for engineering teams and provides a shared server and web-based dashboard that makes it easy to track stability risks, analyze performance, and share insights across development and testing teams. By integrating Detect into continuous testing workflows, software teams can automatically collect and analyze runtime performance alerts as part of their CI/CT pipeline. Unlike traditional debugging methods that depend on reproducing errors, Detect captures issues as they occur, making debugging faster and more efficient.
Detect includes integrated Tracealyzer® support, delivering visual event traces for detected issues without requiring continuous, high-bandwidth streaming to a host. Running independently on-target with minimal performance impact, Detect monitors system stability both in the lab and in the field. When a hard fault exception occurs, Detect automatically captures optimized core dumps that include the call stack, function arguments, and local variables.
While Tracealyzer® can also be used as a standalone tool for continuous trace streaming during active debug sessions, combining it with Detect enables deep, layered observability across the entire team. For full lifecycle visibility, this setup can be extended with Percepio DevAlert® to bring DevOps-level observability to deployed production devices using the same lightweight target integration.
Key highlights
- Capture crashes and risks in real time for systematic visibility
- Debug faster with automatic crash dumps and system traces
- Reduce debugging time by up to 90%
- Monitor your system over unlimited time
- Detect timing and multithreading issues
- Integrates seamlessly into CI/CT workflows
- Private on-premise server for full control over sensitive data
Verify, Detect, Resolve – Release with Confidence
Intermittent errors are notoriously difficult to debug due to limited initial information and the challenge of reproducing them. Percepio Detect™ provides deep observability into crashes, errors, and other detected issues and risks from the very first occurrence. It delivers visual RTOS traces for multithreading issues and exposes call stacks, function arguments, and variables during hard faults.
Percepio Detect also enables systematic monitoring of software timing and resource usage over extended periods without requiring high-bandwidth trace streaming. Performance metrics are tracked directly on the device in real time and trigger alerts when predefined thresholds are exceeded. For high-confidence results, monitoring can run in field testing over many days or weeks, with alerts stored on-device so they persist through crashes and restarts.
Detect monitoring can be integrated into regular integration testing to uncover multithreading risks early, with minimal setup and effort.
Continuous Observability® by Percepio
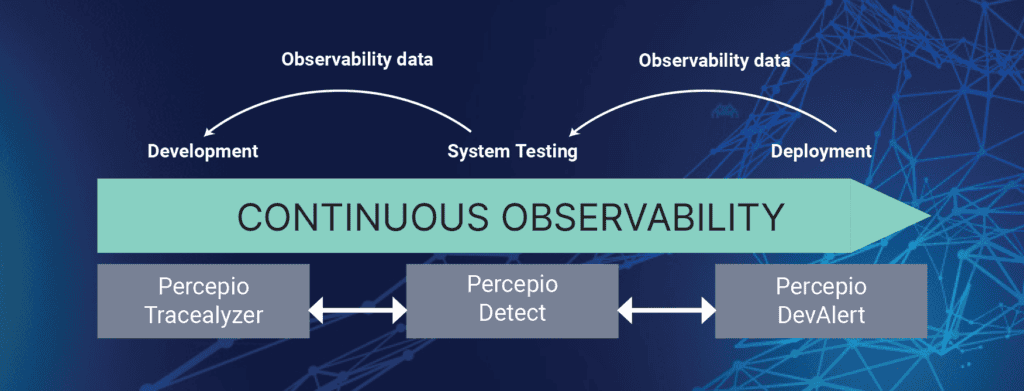
Percepio Detect is a core component of Percepio’s Continuous Observability portfolio, providing deep software insights across all development stages. Whether used during unit testing, integration testing, or in-field monitoring, Detect helps teams build more reliable, maintainable, and high-performing embedded systems.
Let your Observability Driven Development (ODD) journey begin today!

FAQ: Percepio Detect™
What is the performance and memory overhead of Percepio Detect™ on the target device?
The target-side library is highly optimized. CPU overhead is typically under 1%, as tracing is stored in a small, local ring buffer. Memory footprint is minimal; for example, an optimized core dump requires as little as 332 bytes of storage, compared to several kilobytes for static configurations.
Does Percepio Detect™ require a hardware debug probe?
No. Percepio Detect™ is a 100% software-only solution. It does not require a trace port or physical debug probe, making it ideal for automated test benches, CI/CT pipelines, and field trials.
How does the private server deployment work?
Unlike cloud-hosted alternatives, Percepio Detect™ is delivered as a self-hosted Docker package. You host the shared server and web dashboard on your own private infrastructure, ensuring that sensitive device data and intellectual property never leave your network.
How does Detect integrate with Tracealyzer®?
Detect acts as the automated trigger and capture system across multiple devices. When an anomaly is detected, it generates an alert containing a trace snapshot. These snapshots can be opened directly in Tracealyzer® for deep, visual post-mortem debugging and timing analysis.