Getting Started with Tracealyzer on STM32


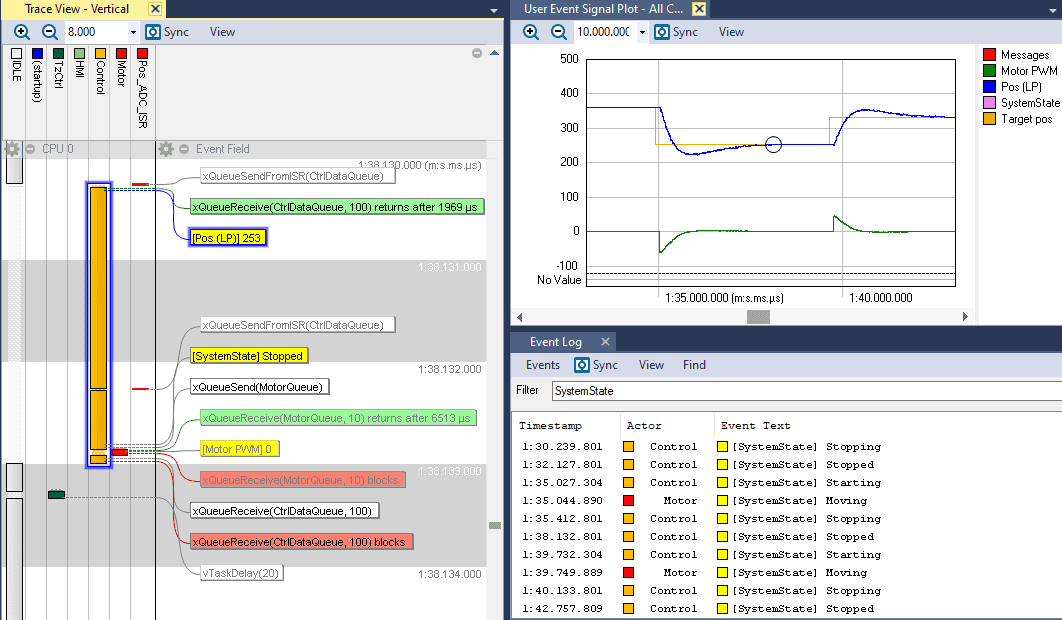
Unlock the full potential of your STM32 device with Percepio Tracealyzer, the ultimate tool for visual trace analysis for all types of embedded software including bare-metal, RTOS and Linux systems.
Tracealyzer speeds up development by simplified debugging and ultra-fast logging, and provides advanced profiling support.
Sign up for free evaluation and try Tracealyzer today.
Snapshot tracing
Watch the video and get started in 10 minutes. See also trace streaming options below.
The easiest way to collect traces from TraceRecorder is by using the RingBuffer streamport module. This keeps the most recent trace data in a circular RAM buffer.
You can use different methods to save snapshots from this buffer and view them in Tracealyzer.
Using the STM32CubeIDE Debug Console:
The easiest method is to use the Debugger Console in STM32CubeIDE. When halted at a breakpoint, run the following command in the Debugger Console:
dump binary value trace.bin *RecorderDataPtr
This saves the trace data to trace.bin, in the working directory of your project. Open this in Tracealyzer using File -> Open.
In case the Debugger Console is not visible, it can be opened using Window -> Show View.
Using the Tracealyzer GDB integration:
Instead of typing in the GDB dump command each time, you can configure Tracealyzer to run this command by clicking on the “Take Snapshot” button.
- Enable the “Shared ST-Link” option in STM32CubeIDE. This is found under “Debug Configurations…” -> “Debugger” tab, in the bottom of the page (you may need to scroll down a bit). The Debug Configurations is found in the dropdown menu from the Debug button.
- In Tracealyzer, click the “Take Snapshot” button to open that window.
- Under “Snapshot Engine”, select “GDB”.
- Now click on the “Settings” button in the “Take Snapshot” window to open the GDB settings.
- Path to GDB: Enter the path to your arm-none-eabi-gdb This is found in the STM32CubeIDE folder, plugins/com.st.stm32cube.ide.mcu.externaltools.gnu-tools-for-stm32.<version>/tools/bin.
- Path to image: Specify the path to the .elf file generated by your build. To locate it, you may right-click on the elf file in the STM32CubeIDE Solution Explorer and select Properties.
- Command to initialize: should be “target remote localhost:<port>”, where <port> is the TCP port number of the ST-LINK GDB server. You can find the port number by starting a debug session and checking the Console log (“Listen Port Number”).
- The other settings can remain unchanged. Save the Tracealyzer settings.
You can now use the “Take Snapshot” button in Tracealyzer, assuming a debug session is active in STM32CubeIDE. This will start a second (temporary) GDB client that sends the dump command to the GDB server, and the resulting trace file is loaded in Tracealyzer.
Note that snapshots can only be read when the system is halted. If the system is running, it will be halted when reading the snapshot.
Using the Percepio TraceExporter plugin
Percepio also provides a plugin for STM32CubeIDE. This gives similar capabilities as the GDB integration in Tracealyzer. The plugin is today somewhat redundant, but can be an alternative solution in some cases. The plugin is available in the Eclipse marketplace at https://marketplace.eclipse.org/content/percepio-trace-exporter-stm32cubeide.
Using the TraceExporter plugin:
- Open the Preferences in the “Percepio” menu.
- Make sure “Tracealyzer path” is pointing to the Tracealyzer executable, not only to the Tracealyzer folder.
- It is recommended to set a fixed “Trace Filename”. Note that this will be overwritten each time.
- Set “RTOS Type” to match your RTOS. If your RTOS is not listed but you are using Percepio TraceRecorder as tracing library, select “Other” and make sure Buffer Address is “RecorderDataPtr” and Buffer Size is “sizeof(*RecorderDataPtr)”.
- Apply and Close.
With a debug session active in STM32CubeIDE, you may now select Percepio -> Save Snapshot Trace. This starts up a new Tracealyzer instance that is connected to the TraceExporter plugin. Repeated snapshots will update that instance of Tracealyzer.
Trace Streaming
Tracealyzer also supports continuous trace streaming for recording long traces, and with live visualization. Trace streaming is supported in many ways and can be customized to use any host-target interface you might have available. To get started, see the below guides:
- Trace streaming in STM32CubeIDE with STLINK v3
- Trace streaming with SEGGER J-Link RTT
- Trace streaming with IAR Embedded Workbench
- Trace streaming with Keil µVision
- Trace streaming using TCP or UDP network connection
- Trace streaming using USB CDC serial connection
- Streaming is also possible via a user-defined stream port.
For information about trace streaming via Segger J-Link, please refer to the general getting-started guide for the RTOS you are using.
For information about TCP, UDP, USB CDC, or custom trace streaming solutions, please refer to the Tracealyzer User Manual. This is found in the Tracealyzer application under the Help menu -> Creating and Loading Traces -> Using TraceRecorder v4.6 or later -> Stream ports.
