Tracealyzer for PX5 RTOS
The PX5 RTOS is an advanced, 5th generation RTOS boasting a native implementation of the POSIX pthreads API. It is designed for the most resource-constrained MCUs all the way through to high-end, multiprocessor MPUs. Tracealyzer provides you unprecedented visualization of the runtime behavior of your PX5 RTOS based system. With Tracealyzer, you will be able to solve problems in a fraction of the time otherwise needed, develop more robust designs and find new ways to improve your software’s performance.


Save Time
- Full system visualisation
-
See pre-crash execution
- Understand true operation
- Full system awareness
Optimize
- Understand processor load
-
Measure paths of execution
-
See inefficiencies
-
Tune memory utilization
Verification
-
Check real-time requirements
-
Match design parameters
-
Ensure best practices
-
Understand upgrade potential
PX5 RTOS
See Your Complete System
Tracealyzer for PX5 RTOS provides complete visualization of the runtime behavior of your PX5 RTOS based system. This is accomplished with over 30 graphical system-level views that complement the C debugger’s detailed, low-level perspective. Tracealyzer gives unprecedented insight that speeds up debugging, validation, and performance optimization. Tracealyzer is extremely useful for understanding execution prior to a system crash. Issues that otherwise may require many hours, days or even weeks to solve, can be understood quickly. Seeing what is really going on in your system will help you avoid many hours of frustrating trial-and-error troubleshooting!
Tracealyzer visualization is based on trace information generated by a lightweight library built for the PX5 RTOS, so you don’t need a high-end trace debugger or any specialized hardware.
Tracealyzer for PX5 RTOS displays kernel events like API calls, context-switches, and ISR processing. You can also log your own custom events, to visualize any event or data in your firmware.
All Tracealyzer versions offer an evaluation period with full functionality along with demo traces, allowing you to explore the features of Tracealyzer without writing a single line of code.
Watch how Tracealyzer can help your development.
PX5 RTOS
See All Threads, API Calls, ISRs and User Events
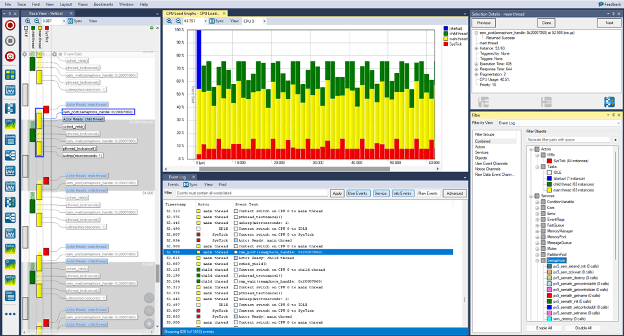
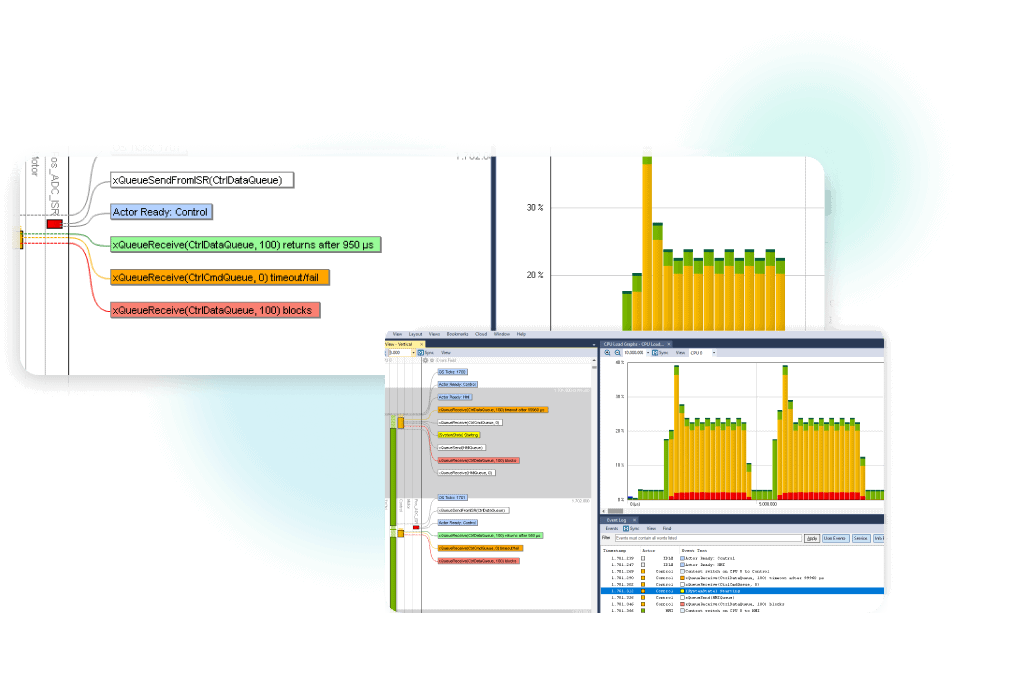
The main trace view shows all recorded events visualized on a vertical timeline, including thread execution timing, interrupts, system calls and custom user events. The thread and interrupt trace are shown as colored rectangles. Events are shown as floating text labels. Zooming is very easy using a click-and-drag selection, which also works as a measurement tool. Threads and events can be clicked and highlighted for additional information, including timing and event dependencies. The lower right corner contains a powerful filter, and the Finder dialog provides even more filtering options. When zooming out, this view naturally transforms into an overview where patterns can be studied.
PX5 RTOS
See Your Application
See Processor Load
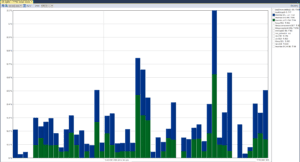
This view presents a horizontal timeline showing the total processor usage, and also processor usage per thread/interrupt. The CPU Load Graph allows for navigating the main trace view, since a double click in the CPU Load Graph focuses the main trace view on the clicked interval. Zooming is allowed in this view as well, independently of other views, and filters are available for focusing on individual tasks or interrupts.
See Thread Timing Variations
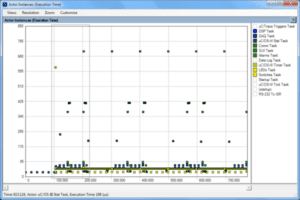
This is an example of several Actor Instance Graphs, each showing the distribution of a specific timing property for an actor, i.e., a thread or interrupt routine. This includes execution time, response time, fragmentation, and several other properties. Each data point represents one specific execution of a thread or interrupt handler. Thread instances with high response times may reveal resource conflicts, e.g., where several threads or interrupts compete for CPU time in a busy interval. This view makes it easier to spot locations that may indicate problems or possibilities for optimization.
See Multiple Views
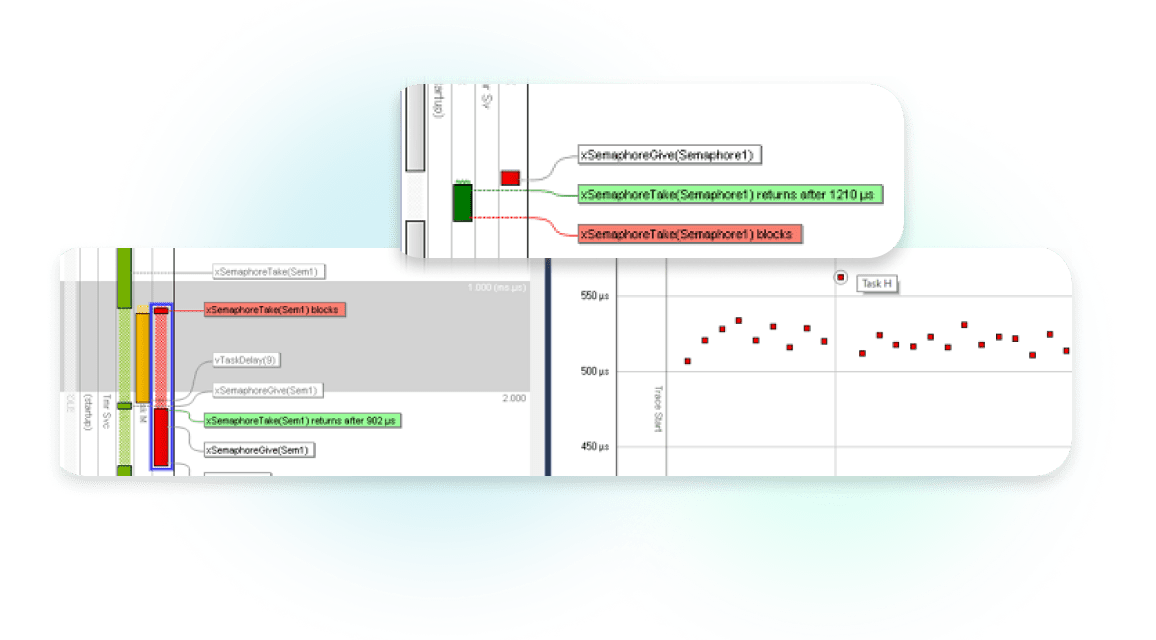
All views with horizontal orientation can be combined in a single parent window, with synchronized scrolling. This allows for spotting patterns that otherwise would be hard to see using individual views, e.g., how the response time depends on other events, and it also allows for greater customization of the user interface.
See Communication Flow
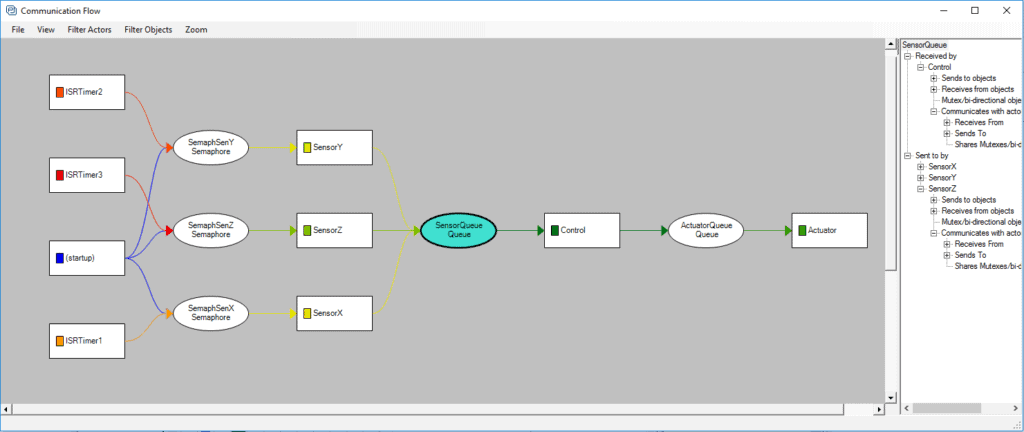
Many system calls allow for communication or synchronization between threads. Tracealyzer understands these dependencies and the Communication Flow graph is a summary of all such dependencies found in the trace, in the form of a directed graph. This is a high-level view of the communication dependencies between threads and interrupts, including kernel objects used such as semaphores and message queues.
Like in all views, double-clicking on a node opens a related view focused on the particular object. Double-clicking on a kernel object (e.g., a semaphore) opens the Object History view (shown below), a list of all events on this specific kernel object. If double-clicking on a thread or interrupt, the Actor History view is opened showing all executions of the actor.
See Kernel Object History
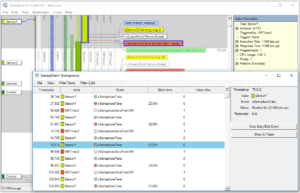
This view shows all events on a particular kernel object, such as a message queue, semaphore or mutex. The events are presented as a list, and double-clicking on a list item shows the corresponding system call in the main trace view. For message queues and similar objects with send/receive operations, it is possible to follow a specific message from send to receive, or vice versa, and also to inspect the messages (by sequence number) in the queue at any given time.
PX5 RTOS
See Your Events and Data
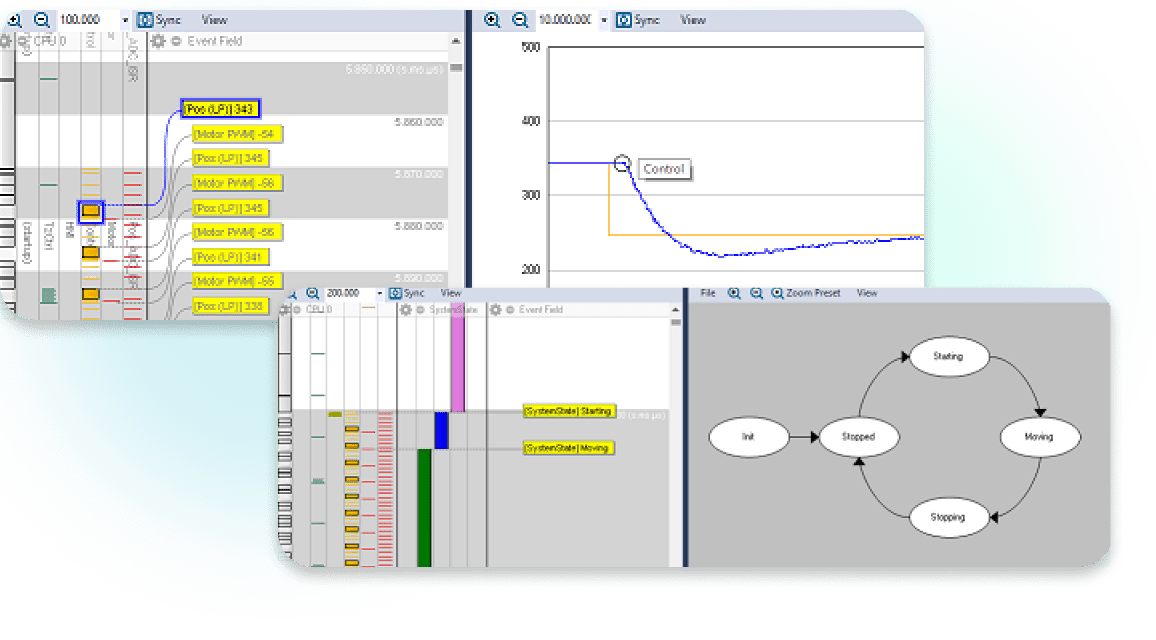
User-defined events, or User Events, allow you to log any event or data in your embedded application. This gives the flexibility of classic debug “printf” calls, but are much faster as all string formatting is done on the host side, in the viewer application. Since you get the events on the same timeline as the kernel trace, it is easy to correlate application events with the other views.
When logging User Events, data arguments can be included and plotted to visualize the changes over time. By clicking on any data point in the plot, the corresponding User Event is highlighted in the main trace view.
This plotting is highly useful for analysis of control algorithms, as it allows you to correlate the plotted data with the other timeline views to find the cause of any anomalies in the plot.
PX5 RTOS
How it works
You do not need any particular hardware to use Tracealyzer, just a suitable development board. You can capture snapshots of the latest activity from a trace buffer in RAM, or stream the data to host using for example Ethernet or a debug probe like SEGGER J-Link, IAR I-jet or Keil ULINK. This way, you can monitor your system over long periods of time and capture any issues.
Tracealyzer for PX5 RTOS relies on the Percepio TraceRecorder library, available on Github under the Apache 2.0 license. This is integrated in your project within a few minutes by following the Getting Started guide for PX5 RTOS. Also make sure to read the Tracealyzer user manual to learn how to connect and record traces (see the Help menu).
Tracealyzer works with most embedded processors (e.g., Arm devices and others) and essentially any C/C++ compiler. Percepio provides plugins and integrations for common development tools, including Eclipse/GDB, STM32CubeIDE, Keil MDK, IAR and Lauterbach.

Problems that otherwise would take days to solve are obvious with this tool and just a quick fix.
Stay informed.
Sign up for our newsletter.
Our Products
Percepio® is the leading provider of observability tools for embedded and IoT software systems in development, in testing, and in the field.
TRACEALYZER
Percepio® Tracealyzer combines software tracing with powerful visualizations, allowing users to spot and analyze issues in software recordings during development and testing.
DETECT
With Detect, Percepio’s newest observability tool, you can bridge the siloed views in development, test and maintenance of deployed products. Optional CI integration allows for automated collection of issues and metrics into your existing CI pipeline.

