DevAlert
Deep Observability for Critical Edge Software
Get cloud-based observability on anomalies in edge devices and embedded software. Detect and analyse issues remotely, during testing and in deployed devices. Use your familiar desktop tools for secure remote debugging.

Release Sooner
Solve elusive bugs during system testing by deep observability into the software, with easy remote access for all team members.
De-risk Product Launch
Testing does not find all bugs and vulnerabilities. Detect issues in customer devices, understand the cause and provide rapid solutions.
Efficient Technical Support
Increase first contact resolution. Like diagnostic trouble codes in cars, but for any product and with remote access.
Watch the demo video
Cloud-connected Remote Debugging
Debug remotely and securely without needing to expose a physical debug port.
Source-code Debugging and System Tracing
Inspect core dumps from remote devices in your favorite debugger. Capture traces for Tracealyzer.
For Online Devices
Automatic alerts from device to cloud, visible in DevAlert within seconds.
For Offline Devices
Upload the data via a host device, or store alerts on the device for later retrieval.
Customize and Extend
Create custom alerts on any condition, with any device data, for any desktop tool.
Data Control and Privacy
Use your own private data storage and maintain full control over the diagnostic data.
Deep Observability
DevAlert lets your devices provide automatic alerts on when errors are detected, including core dumps and traces that helps explain the problem. Define your own alerts and include any device data of relevance, for example logs or sensor readings. Everything is easily accessible from the DevAlert dashboard in your web browser.
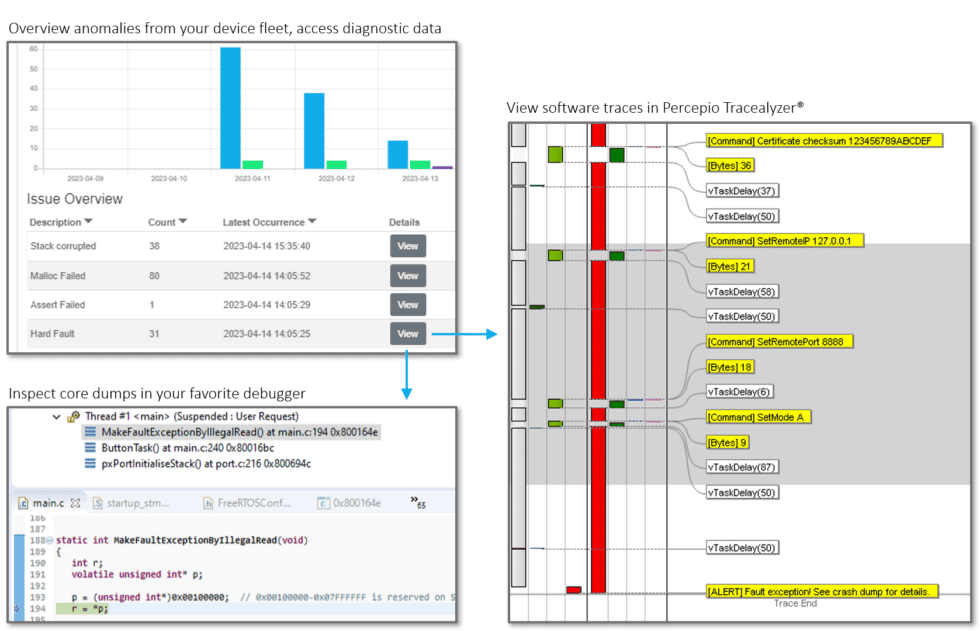
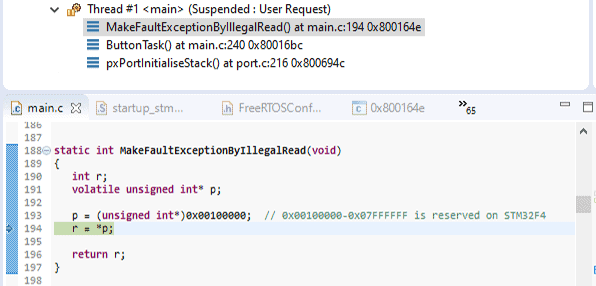
Show core dumps from a remote device with a single click in the dashboard. Hook in your regular source code debugger and get the same familiar experience as if debugging a local device on your desk. Inspect the call stack, function arguments, variables, registers and more.
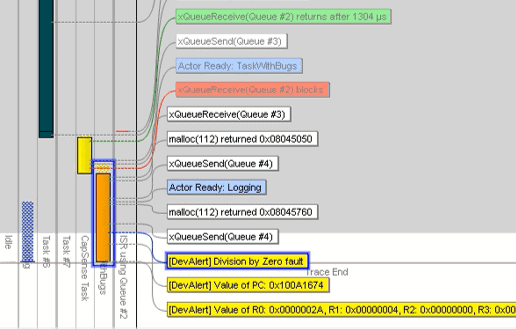
Collect system traces for Percepio Tracealyzer and see the software events just before the anomaly was detected, including RTOS task execution, traced API calls and custom application logging. This helps you understand the circumstances of the error.
Alerts are small (kilobytes or less) and can thereby be stored or uploaded quickly. The device can then resume operation, or restart if needed, without any noticeable delay.
On Software Issues
Despite extensive testing there is no way of telling if all bugs have been found, and typically that’s not the case. Many edge/embedded devices are developed in native C/C++ code that is prone to elusive bugs. Especially when using RTOS platforms and multitasking.
DevAlert lets you capture runtime errors automatically, in full detail, and provides email notifications on new issues. This ensures that you notice the issue on the very first occurrence and quickly understand the problem, without first having to reproduce the issue in the lab. This minimizes debugging time and is crucial for resolving issues in deployed devices.
If combined with over-the-air software updates, you can rapidly stabilize your software in deployed devices by providing proactive updates, before many customers have been affected.

On Physical Malfunctions
Anomalies in the physical world are often observable from software, for example a dislodged connector resulting in a software error code, or a sensor reporting an abnormal value. In the automotive world these are provided as DTCs, Diagnostic Trouble Codes. DevAlert can provide a custom “DTC” solution for your product, with remote cloud-based access and deep observability when needed.

Sometimes an error code is all you need to know what is wrong, at least if you are a domain expert and have seen the same issue in the past. But not all team members have that kind of experience. DevAlert can simplify troubleshooting for less experienced team members by including references to documentation on known issues and recommended solution.
More powerful diagnostics can be enabled by using the efficient Tracealyzer recorder for logging sensor readings, user interface events and other physical events that are observable from the software. The most recent data points can be included in your alerts and viewed in Tracealyzer to better understand the reported anomaly.
Traditional logging tends to produce vast amounts of mostly irrelevant data and is a trade-off between the amount of details provided and the amount of data produced. DevAlert avoids this trade-off by only uploading the most recent data when anomalies are detected in the device. This allows for very detailed logging, while also reducing the amount of uploaded data by several orders of magnitude.
On Cybersecurity Anomalies
Edge devices are often prime targets for cyberattacks due to weaker security and many attack surfaces accessible to the public, such as UARTs, USB and radio protocols. They can be used to gain access to the wider corporate network. All it takes is a single compromised device.
DevAlert offers a platform for cybersecurity anomaly detection by making it easy to report suspicious events from your device software. The deep observability offered by DevAlert lets you determine if the anomaly was caused by an attack or by an accidental error. This can reveal zero-day vulnerabilities, attacks and intrusions within seconds, enabling rapid mitigation and accurate cyber forensics.

Desktop Integration
DevAlert is a hybrid device/cloud/desktop solution where advanced debugging is provided by desktop tools such as GDB and Tracealyzer on your local computer. This way, you don’t need to learn a new interface but can leverage familiar tools to analyze data from remote devices. This also makes DevAlert very extendable as you can add custom payload types and map them to any appropriate desktop tool. For example a source-code debugger for viewing core dumps, a text editor for viewing log files, or Tracealyzer for viewing system traces.
This approach is enabled by the Dispatcher tool, a DevAlert client that runs on your local computer. This connects the cloud parts with your desktop tools for a smooth workflow. You simply click the links in the dashboard, and the device data show up in the appropriate tool according to your Dispatcher setup.
This combines the convenience of a fully managed cloud service with the privacy, data control and extendibility of local data processing.
Data Control and Privacy
Unlike other cloud-based observability solutions, DevAlert does not consume or store sensitive device data like firmware images, core dumps, logs and traces inside the hosted cloud service.
Such data remain in your own private storage at all times where you are in full control. This can be for example an S3 bucket in your own AWS account, or a backend server that is already used by your devices. This is separated and isolated from the hosted DevAlert cloud service, but the data is still easily accessible from the DevAlert dashboard due to the novel desktop integration via the Dispatcher tool.

Release Sooner
During integration testing and system testing, it is not uncommon to encounter errors that are difficult to repeat and where the debugging becomes very difficult and time consuming. Your team may need to spend months of frustrating trial-and-error efforts on various issues encountered during the testing, since not having enough information. DevAlert lets you avoid this “debugging hell” by providing critical information for effective debugging. This can reduce debugging time by 90% or more, and debugging is often around 50% of software development. This way, you can launch earlier, sell more units during the first year and thereby increase revenue.
With DevAlert, you can monitor all your devices under test and get deep observability on issues, remotely and with shared access for all stakeholders, and without needing bulky and expensive tracing hardware for each device. Developers can work remotely on debugging issues from system testing, e.g. when traveling or when issues occur in remote test labs or during field trials. The dashboard also provides an overview for product managers and other stakeholders that wants to monitor the testing progress and the number of detected issues. And you don’t need to expose a physical debug port on the device, as the monitoring can leverage any I/O or network interface like Ethernet, Wi-Fi or USB.
DevAlert is not only for detecting errors and crashes, but can be used for any anomaly of interest. For example, if your system is tracking important performance metrics where you have an upper limit, you can use DevAlert to report violations and include a Tracealyzer trace to understand the cause.
DevAlert is suitable for most embedded software testing. The data can be transmitted over a serial port or debugger to a host PC, so you don’t need any additional debugging hardware. And you don’t need cloud connectivity in the device since the alert upload can be performed by the host computer.
De-risk the Product Launch
Your company has launched a new device, but something is not right. More and more customers are complaining about devices not performing as expected. Your team suspects a bug in critical code but cannot reproduce the issue. Customer support staff work overtime but can only provide workarounds, and the issues keep coming back. Customers are dissatisfied and bad online reviews are piling up.
DevAlert provides a diagnostic feedback loop from deployed devices to developer and support teams, with full insights into device behavior at scale. On the very first occurrence of an issue, DevAlert provides a notification to the developer team and detailed diagnostic information such as core dumps and event traces for effective debugging and rapid solutions. It is also possible to monitor critical system health metrics like stack usage and send a warning if higher than expected. This way, developers can make proactive improvements to avoid future problems.
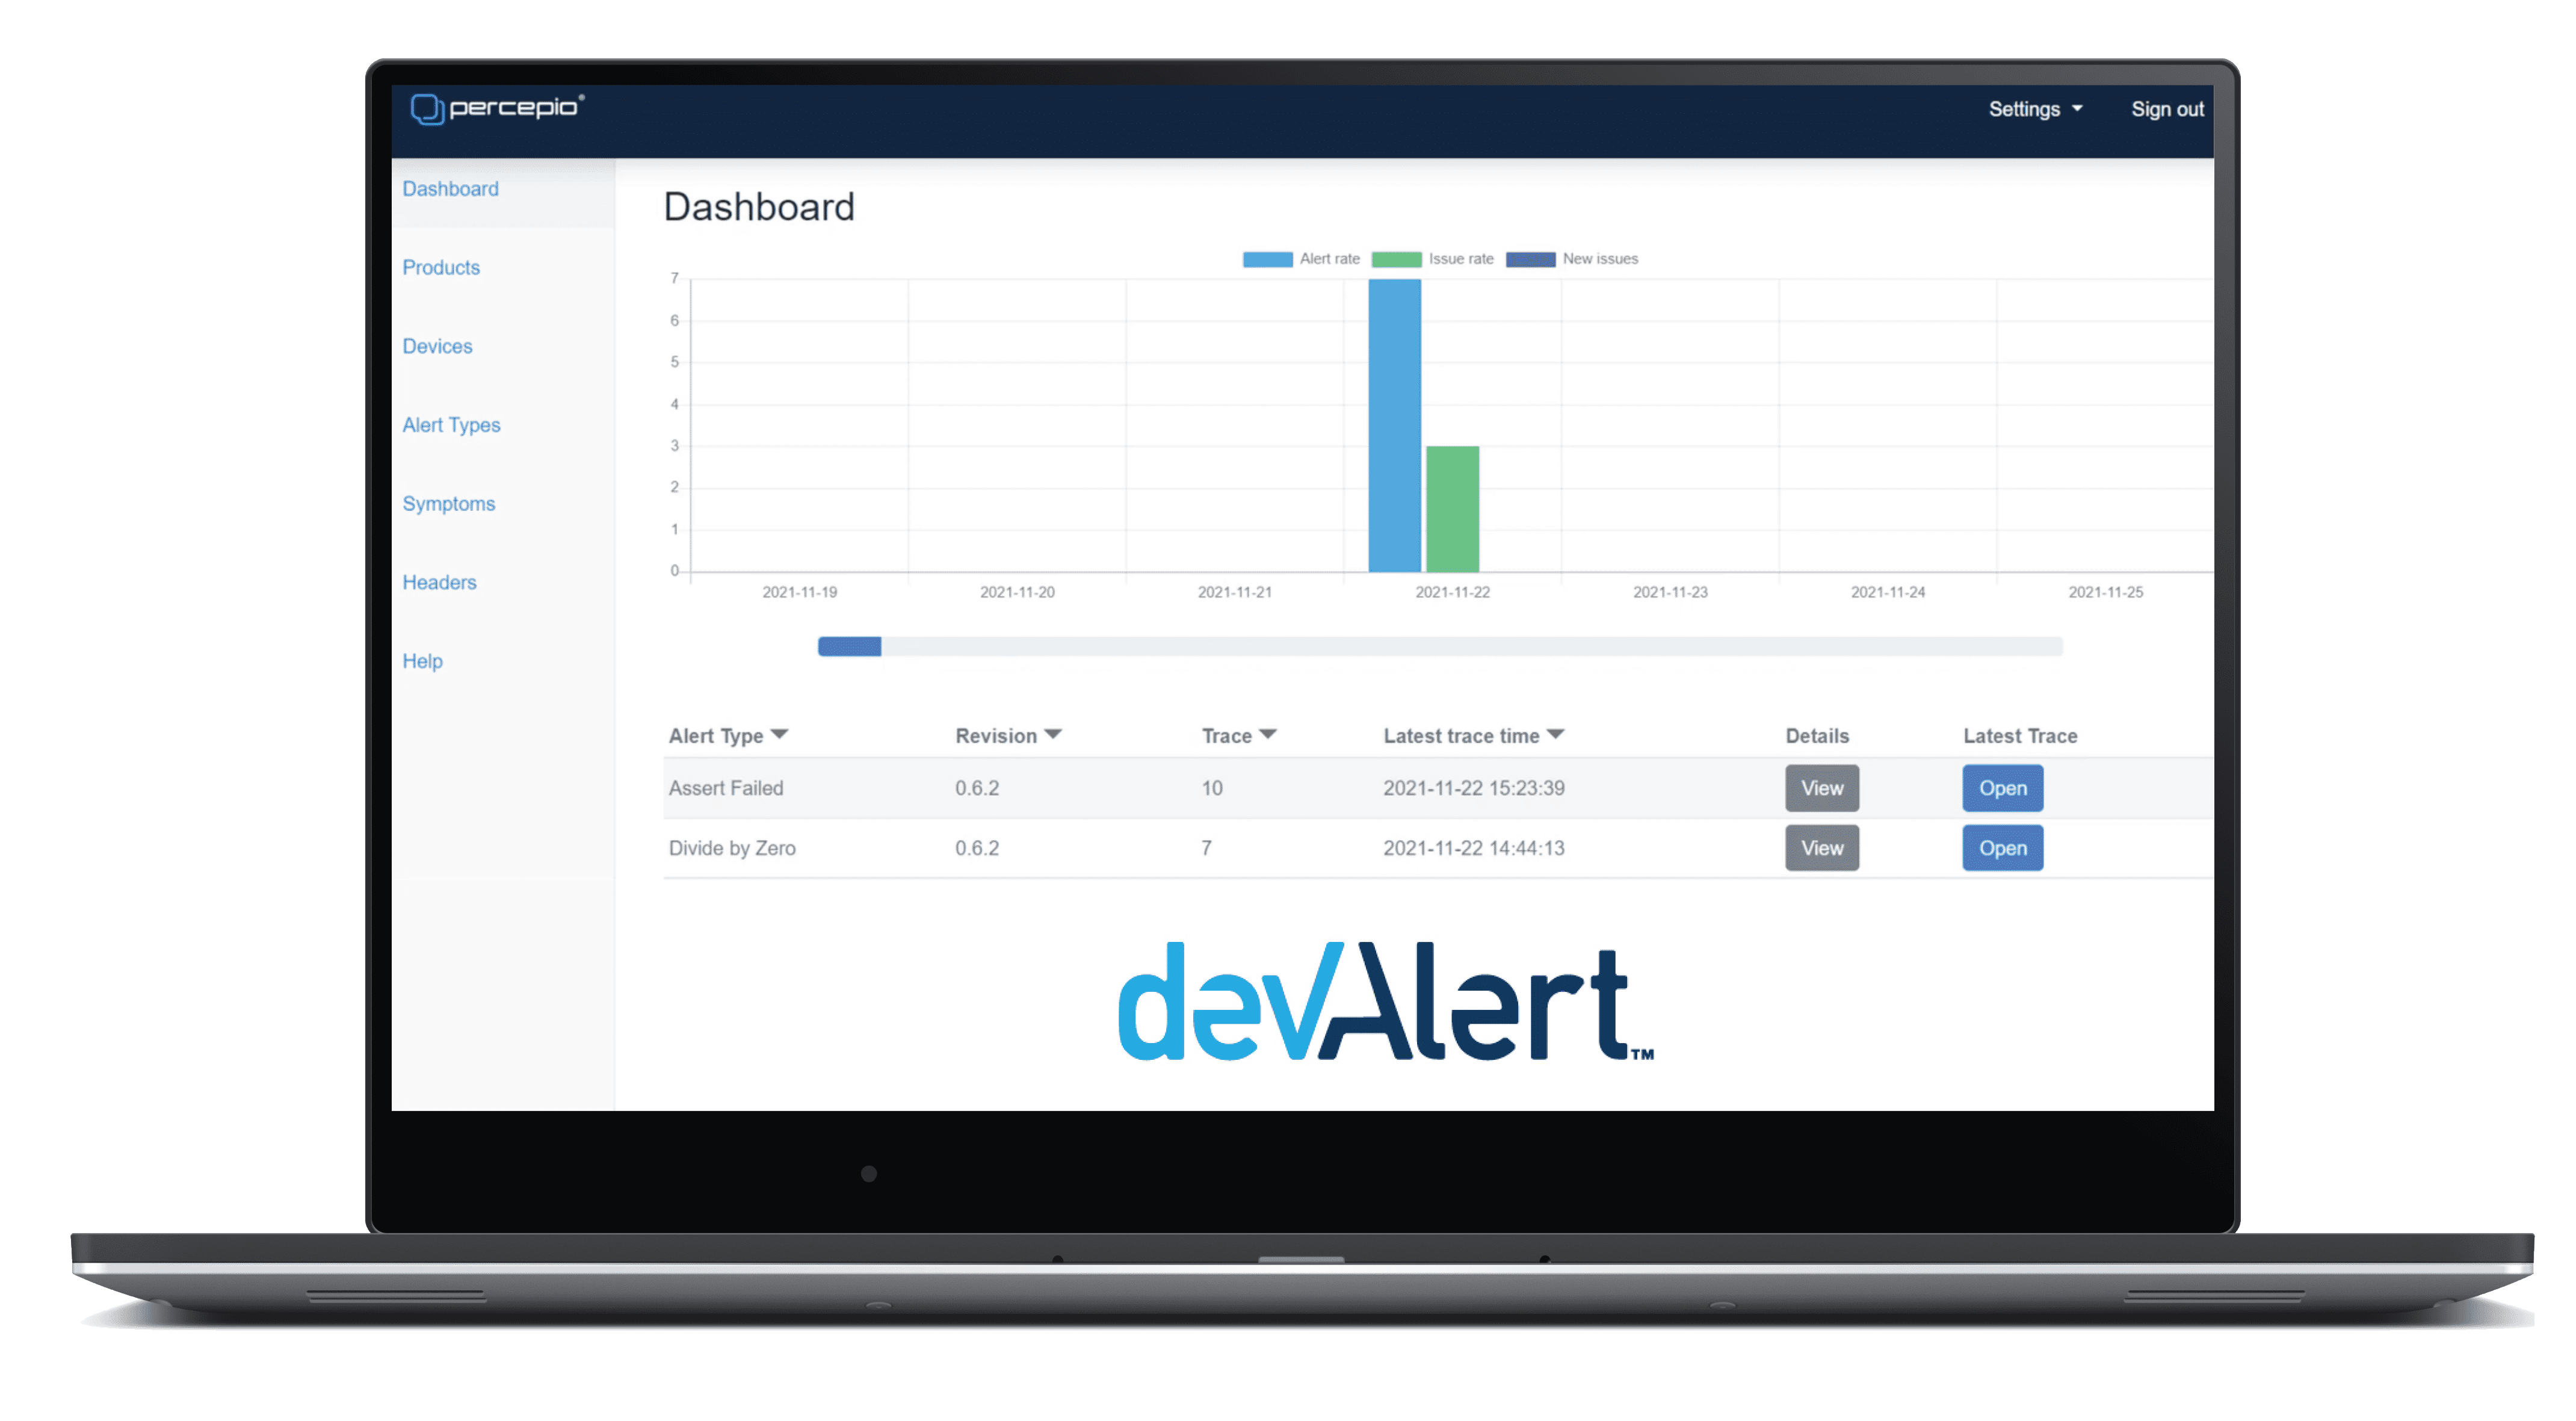
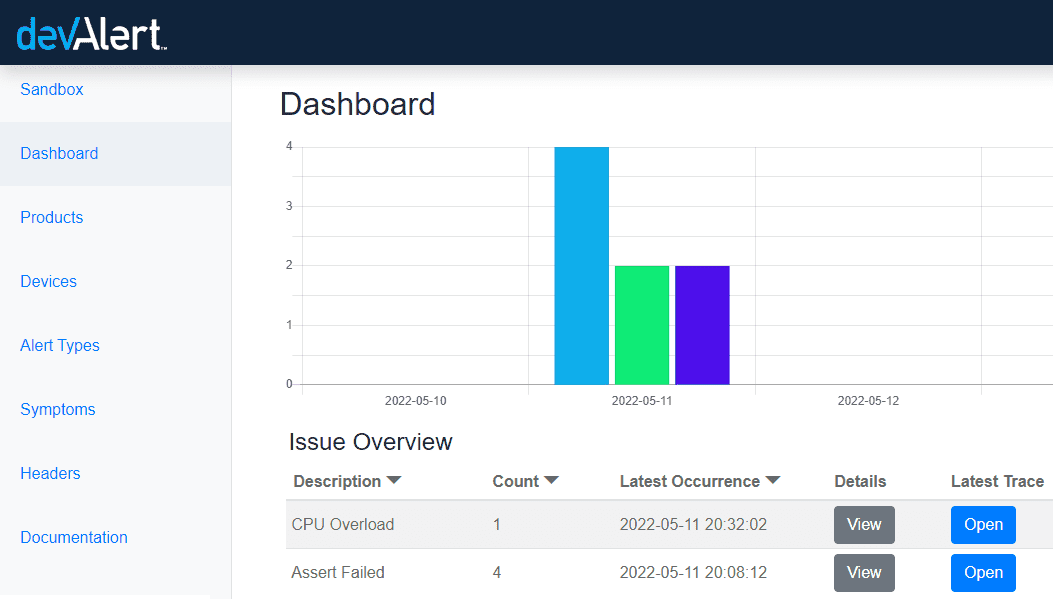
The DevAlert Dashboard summarizes all alerts and provides a compact to-do list of the underlying code issues, and highlights new ones to ensure nothing is missed. You’re also able to see how many times each anomaly has occurred, so you can prioritize multiple issues at the same time.
What people are saying
Watch the interview with Sensorbee about their use of DevAlert
It’s very important for us to deliver new functionality quickly, from a customer request all the way out to the field. DevAlert helps us accelerate the growth of the company as we can deliver new functionality faster and with the high quality expected by our customers.

The world has been waiting for a solution like DevAlert. DevAlert will revolutionize product quality and it’s a must-have for any embedded or IoT project.

DevAlert pushes data about problems to the cloud. Importantly, it characterizes each event so the developers are not overwhelmed with multiple reports of identical bugs. As one who has had to fly around the world carrying heavy debugging tools, the idea of getting the info you need to your desk sure is appealing.
