Tracealyzer Features and Capabilities
Percepio Tracealyzer provides RTOS-aware event tracing and is widely recognized for its leading trace visualization, simplifying debugging and performance analysis of embedded software. The many visual overviews offer a comprehensive picture of the system behavior where anomalies are easy to spot. The views are linked for easy drill-down – double-click to see the details. The host application supports Windows and Linux (x86-64).
Trace Views and Reports
Trace View
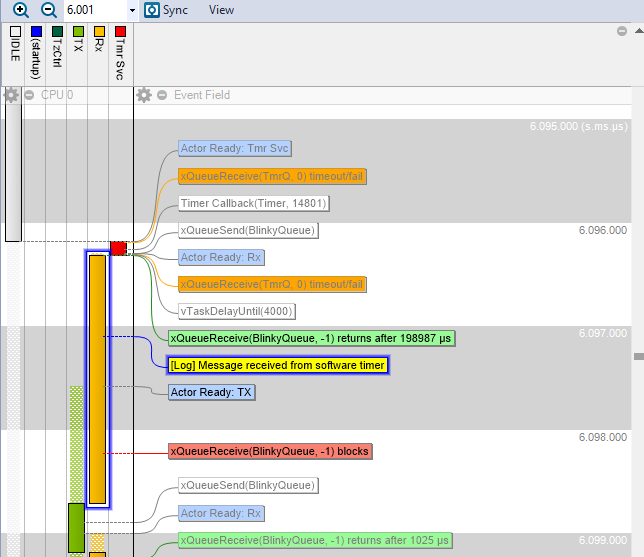
Provides a graphical timeline showing thread execution, interrupt handlers, kernel API calls and custom user event logging in your code. Ensure that your threads run as expected and that thread scheduling priorities are suitable for your application.
CPU Load Graph
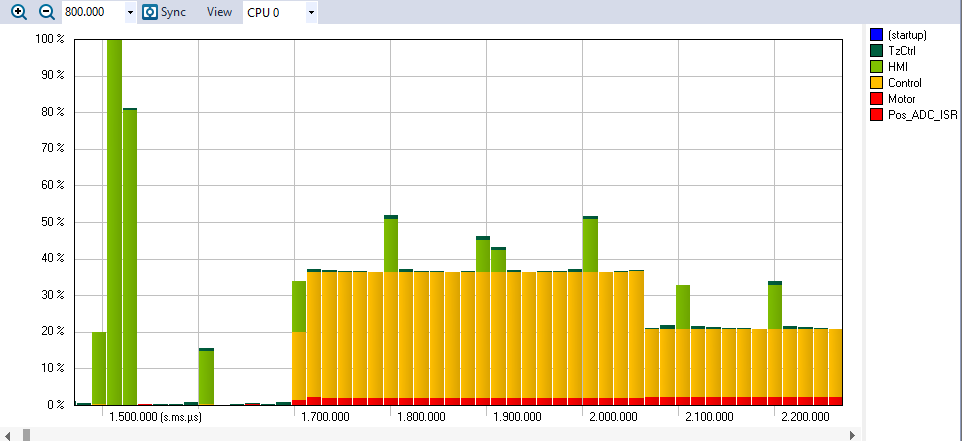
Shows the relative amount of CPU time used by each task/thread and interrupt handler, as well as total CPU usage. Find hotspots with high CPU load, where code optimizations can bring the largest performance improvements.
Event Log
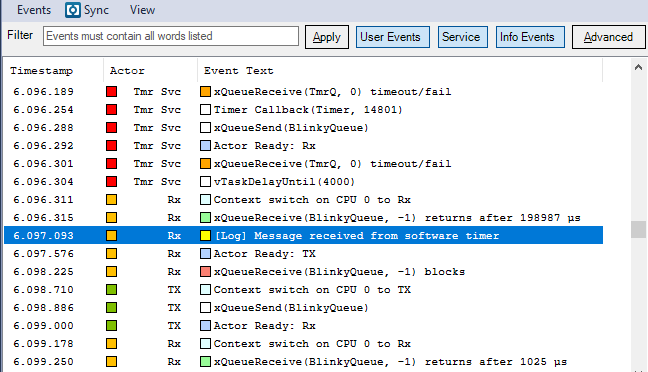
Shows a list of the logged events, including both kernel events and user events. Easy to search and filter. Double-click to highlight events in the trace view, for example custom user events logged in your application code.
Communication Flow
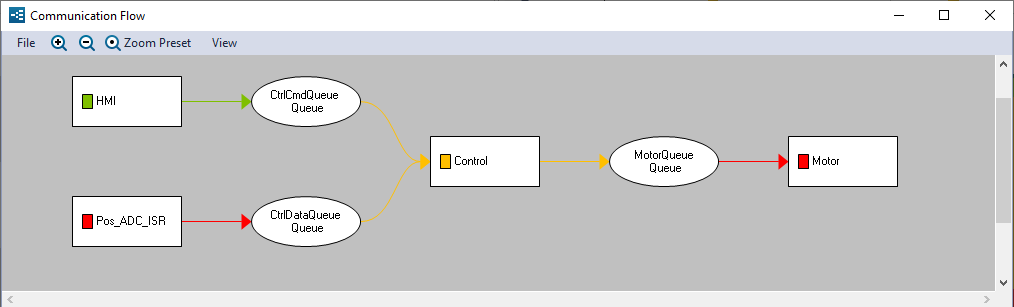
This view shows a summary of the runtime interactions between your threads, such as IPC and synchronization events. See what threads that are using a certain RTOS object, for example a mutex, semaphore or queue. Double-click to see the events.
Data Plot
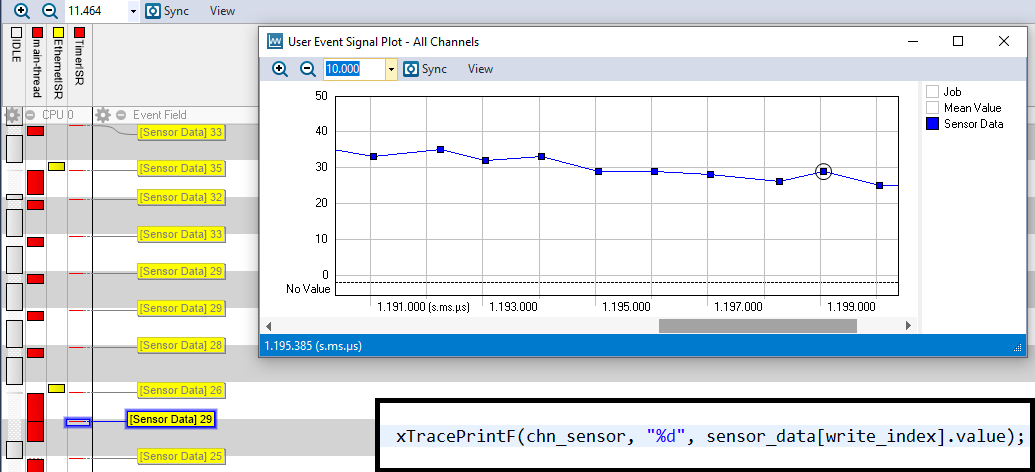
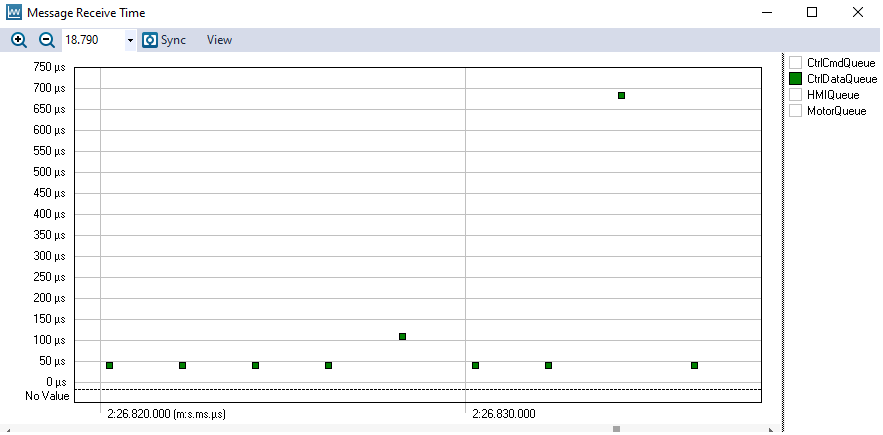
Visualizes logged user event data as a plot over time. Toggle the visibility of each user event channel in the right-side legend. Double-click on data points to show the corresponding event/sample in the trace.
Data logging with user events is typically hundreds of times faster than printf calls, allowing for extensive logging with minimal overhead.
Heap Memory Usage
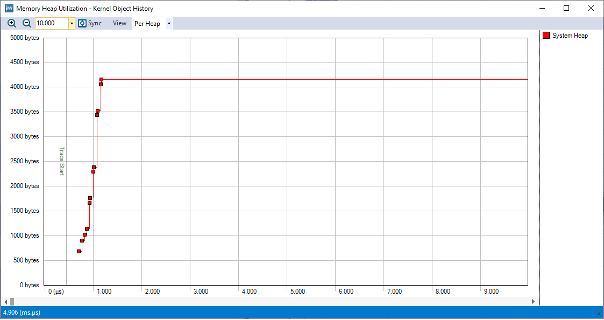
See dynamic memory allocation (malloc/free) over time to optimize your heap size and check if you might have memory leaks. Double-click the data points to find the corresponding memory allocations in the trace view.
Stack Memory Usage
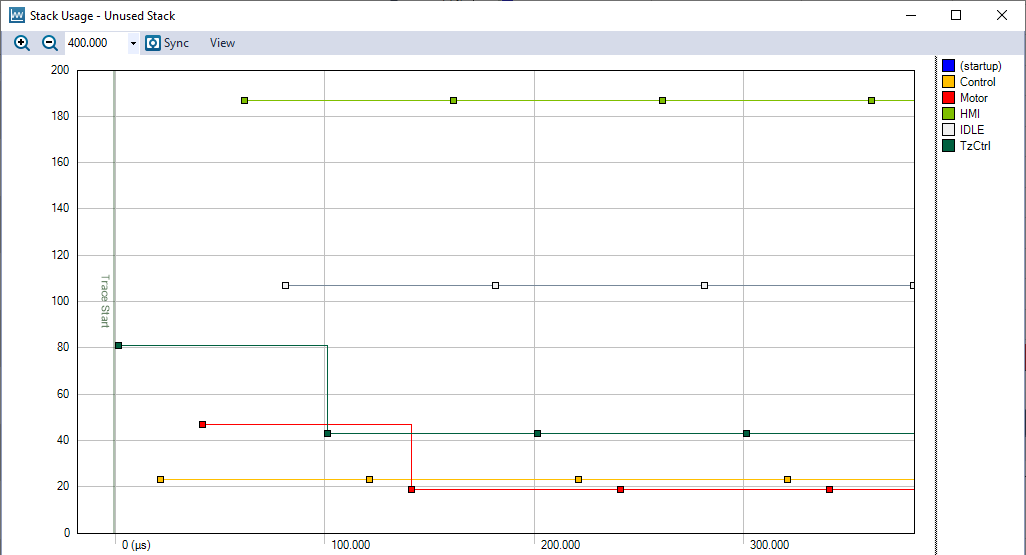
Monitor the amount of unused stack for each thread, as a plot over time. Make sure you have enough safety margins to avoid stack overflow, while not being too large and wasting too much of your precious RAM.
Timing Metrics per Job
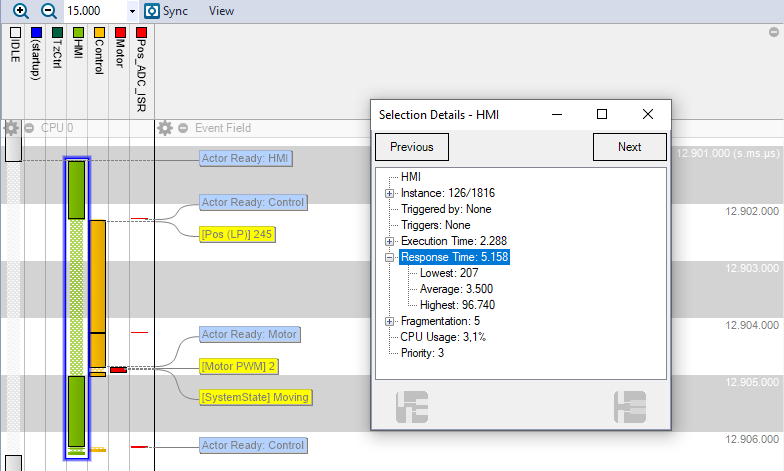
See metrics on thread timing per job, like the highest execution time and response time. Double-clicking an extreme value navigates the trace view to the corresponding job. This makes it easy to find “bottleneck” situations where the software latency is higher than normal
Thread Instance Graphs
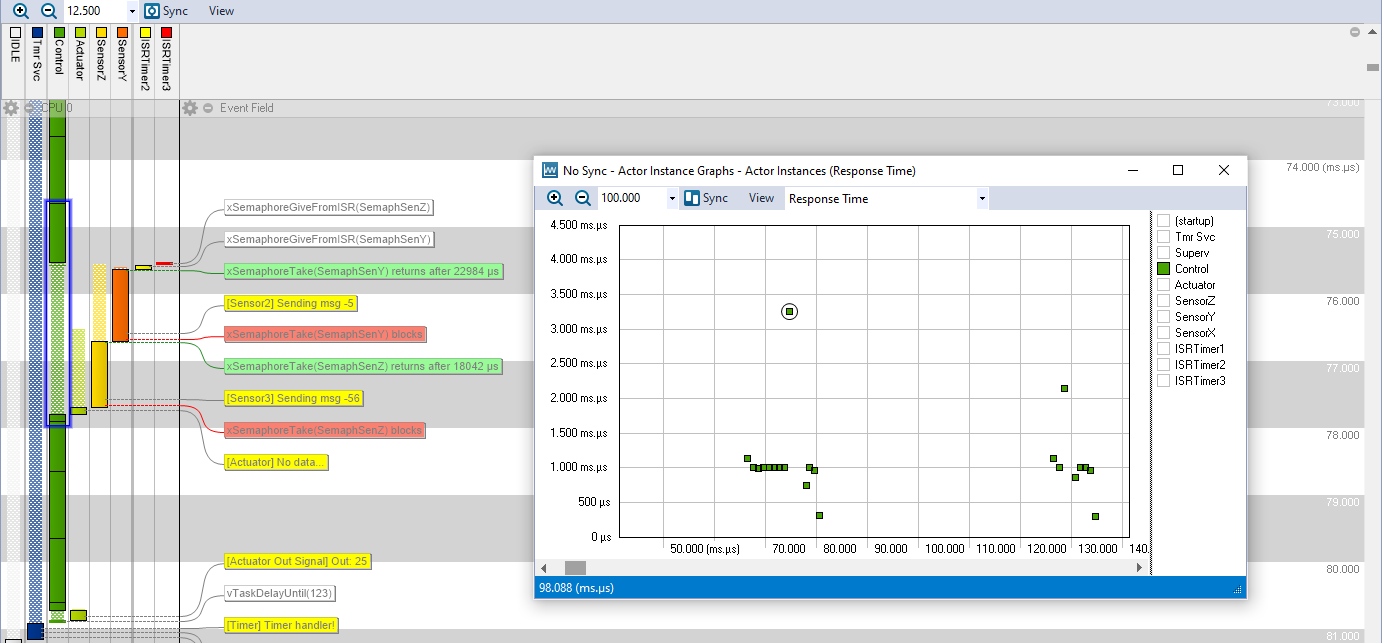
Plot thread timing metrics per job, such as execution times, response times, and periodicity. This lets you overview timing variations, that are important for reliable performance and system-level testability.
Interval Tracing
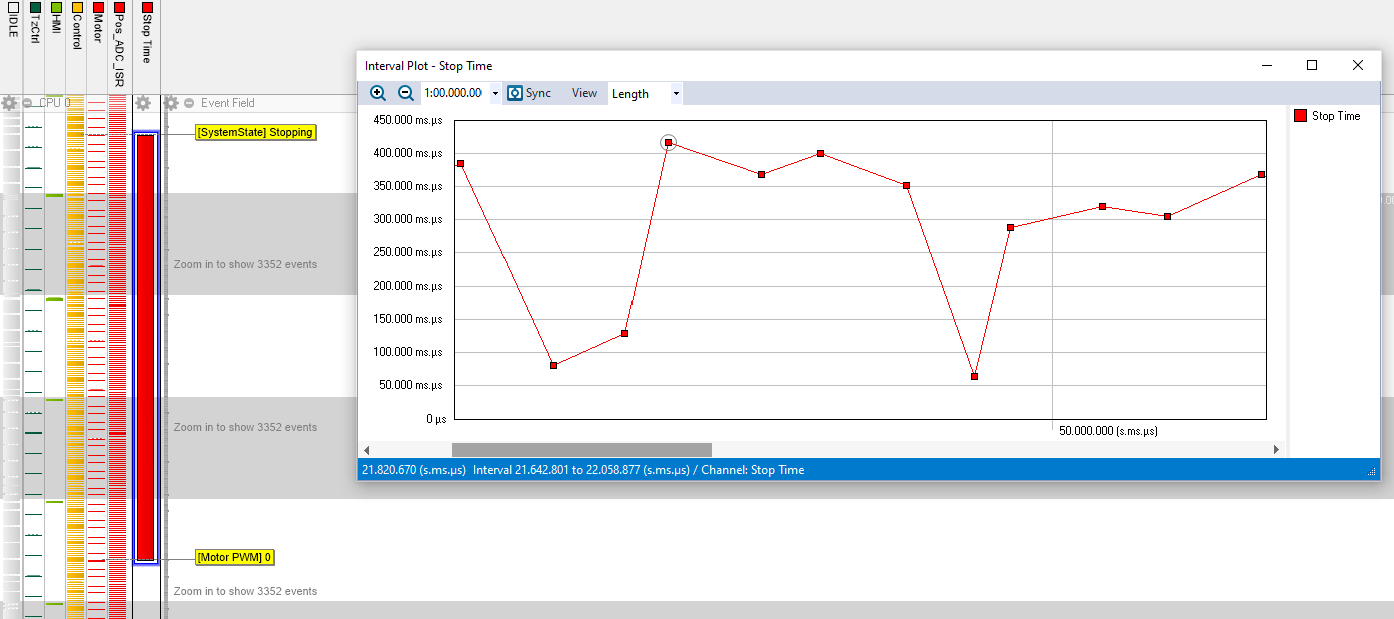
Profile and visualize the time between two logged events in the code, also across threads and interrupts. Generate reports with statistics and see visual plots of interval timing variations.
State Machine Tracing
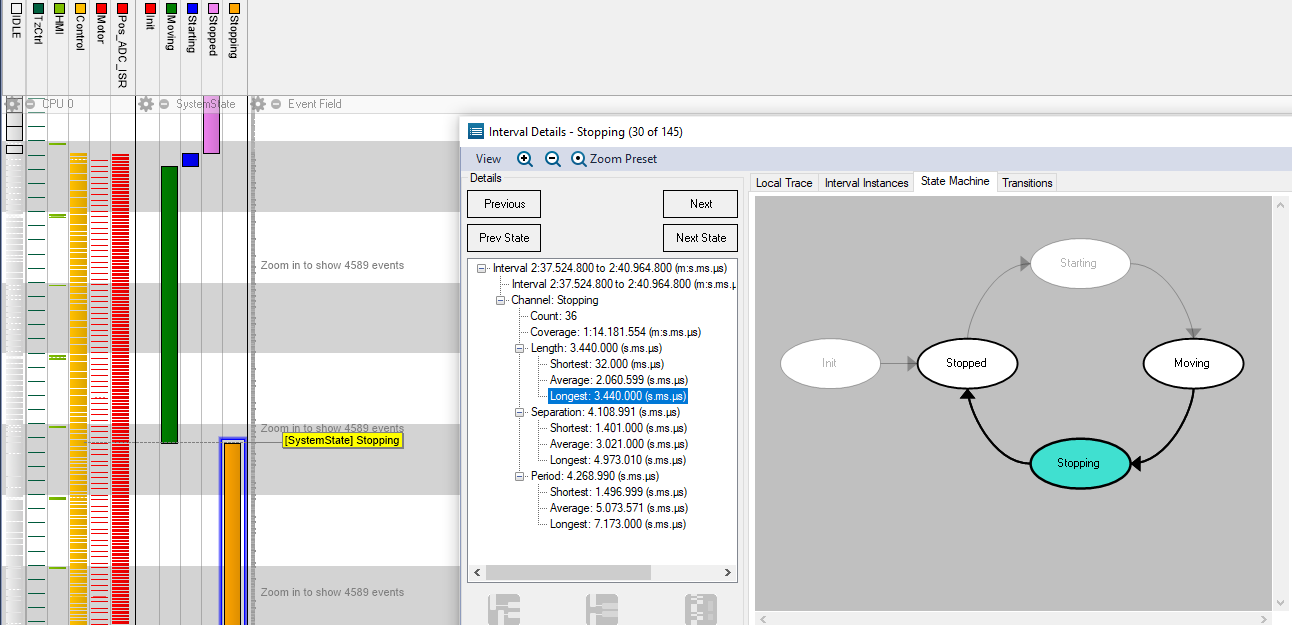
Visualize logged state transitions of any kind, both in the trace view and as state diagrams. States can also be profiled in the same way as intervals.
Runnable Tracing
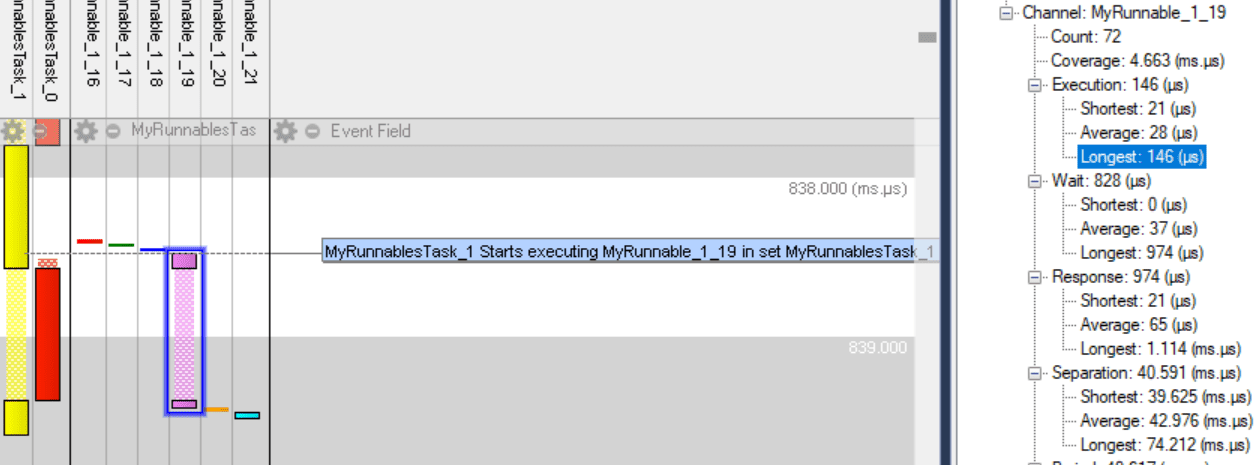
Profile and visualize sections of code within a single thread, for example important functions or cases in a switch statement. Unlike intervals, runnables are bound to a specific thread and provide the execution time within the thread, excluding preemptions.
Export Statistics Reports
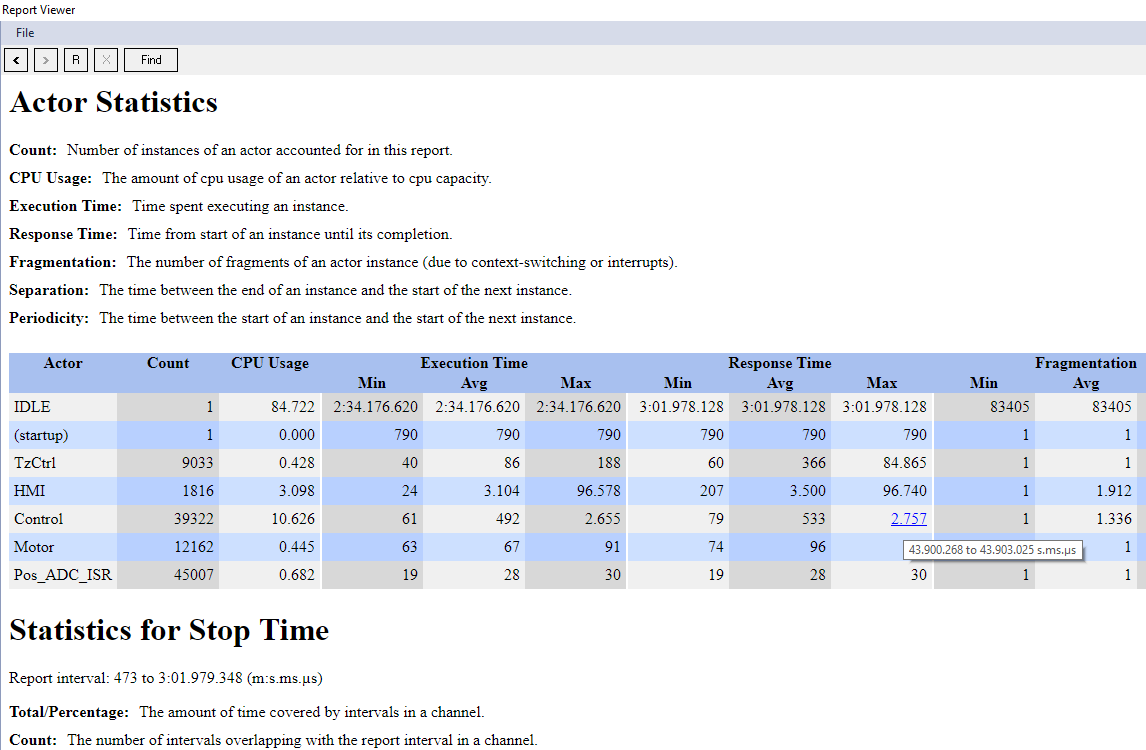
Generate and export reports for thread timing metrics, custom intervals, states and runnables. Clicking on Min and Max values shows the specific instance in the trace view.
Advanced RTOS Analytics
See plots of various RTOS-related performance metrics, such as IPC message latency, IPC blocking time, dynamic priority changes, queue utilization, service call intensity, etc,
Simple and Powerful Search
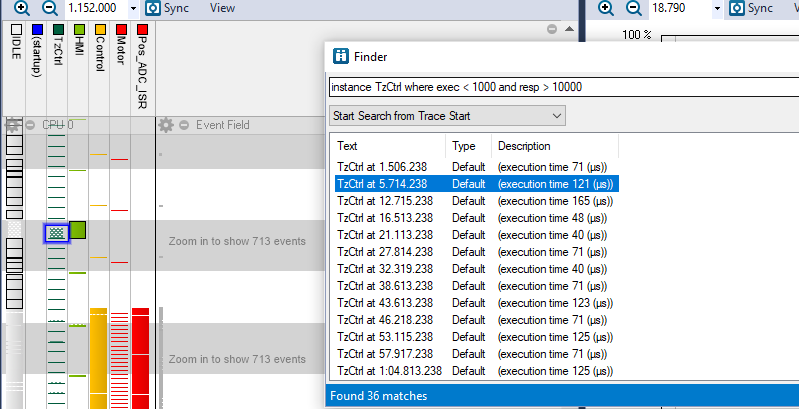
Quickly find any event in the trace using the Event Log Filter, or simply press Ctrl-F and type in the first characters for auto-completion. The more advanced Finder window lets you enter SQL-like queries and lists all matches. Double-clicking a match highlights it in the trace view.
General Capabilities
Trace Streaming
Record long traces and see animated real-time views during tracing sessions. Supports streaming over J-Link RTT, ITM, TCP/IP, UDP and more. Customizable for any interface.
Snapshot Tracing
The trace data remains in a device RAM buffer until requested. An easy way to see the most recent events, like what happened between your breakpoints. Works also over slow connections.
Multicore Tracing
Tracealyzer supports unified tracing on multicore SMP system, where a single kernel instance manages multiple processor cores.
Compact logging, ELF Support
Offers more efficient tracing and logging support, where string constants (like object names) are logged by the address only, instead of logging all the characters. Such references are automatically translated in Tracealyzer using the ELF image.
Trace Preview
The Trace Preview window offers a quick overview of large traces, that opens within seconds even for very large trace files. This is based on an trace index that is generated during streaming sessions. The preview lets you limit the trace loading to a selected section for faster loading and more focused visual analysis.
Multiple Data Exports
Export the event log, user event plot and statistical data in text, XML and CSV formats.
Project Settings for Multiple Targets
Have separate Tracealyzer settings for multiple target systems and switch between them easily.
Custom Integrations
The Tracealyzer SDK enables customers and partners to create custom Tracealyzer extensions for any C/C++ software and take full advantage of the powerful capabilities in Percepio Tracealyzer. This enables integration with any RTOS, as well as custom tracing of library/middleware APIs. Not required for already supported target OS.