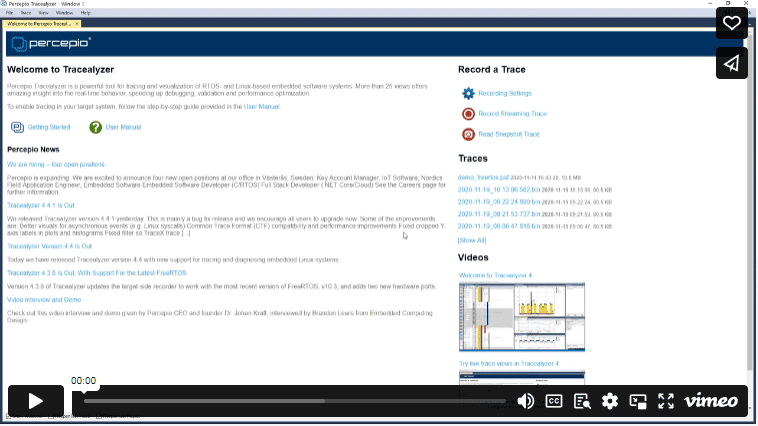
Tracealyzer for FreeRTOS
Developing FreeRTOS-based software can be challenging without effective debugging and analysis tools designed for multi-threaded code. Percepio Tracealyzer is the leading FreeRTOS analyzer since 2012, formerly known as FreeRTOS+Trace. Solve issues quickly and speed up everyday development. Optimize your system for reliable real-time performance. Get your free evaluation and get started in 15 minutes!

“Tracealyzer has always offered exceptional value to our global community of users by giving engineers direct insight into how their applications are executing. This information is invaluable when both optimizing and debugging FreeRTOS applications.” – Richard Barry, FreeRTOS.org
Simplify Debugging and Develop Faster
“Tracealyzer has doubled our development speed. Problems that would take days to solve are obvious with this tool and just a quick fix. We use it all the time.” — Alex Pabouctisids, Lead Firmware Engineer, Flyability
Fed up with endless hours debugging embedded C/C++ code? Bid farewell to tedious troubleshooting and welcome accelerated development with Percepio Tracealyzer. Traditional debugging is often ineffective for today's complex RTOS or Linux systems and may consume 40-50% of the development time.
Get visual trace observability to speed up your everyday debugging and solve issues where traditional debugging falls short. Learn how Tracealyzer simplifies debugging.
Optimize System Performance
“In less than 5 days from running the tool, we improved the performance of our graphic rendering engine by 3x” - Terry West, CEO, Serious Integrated, Inc.
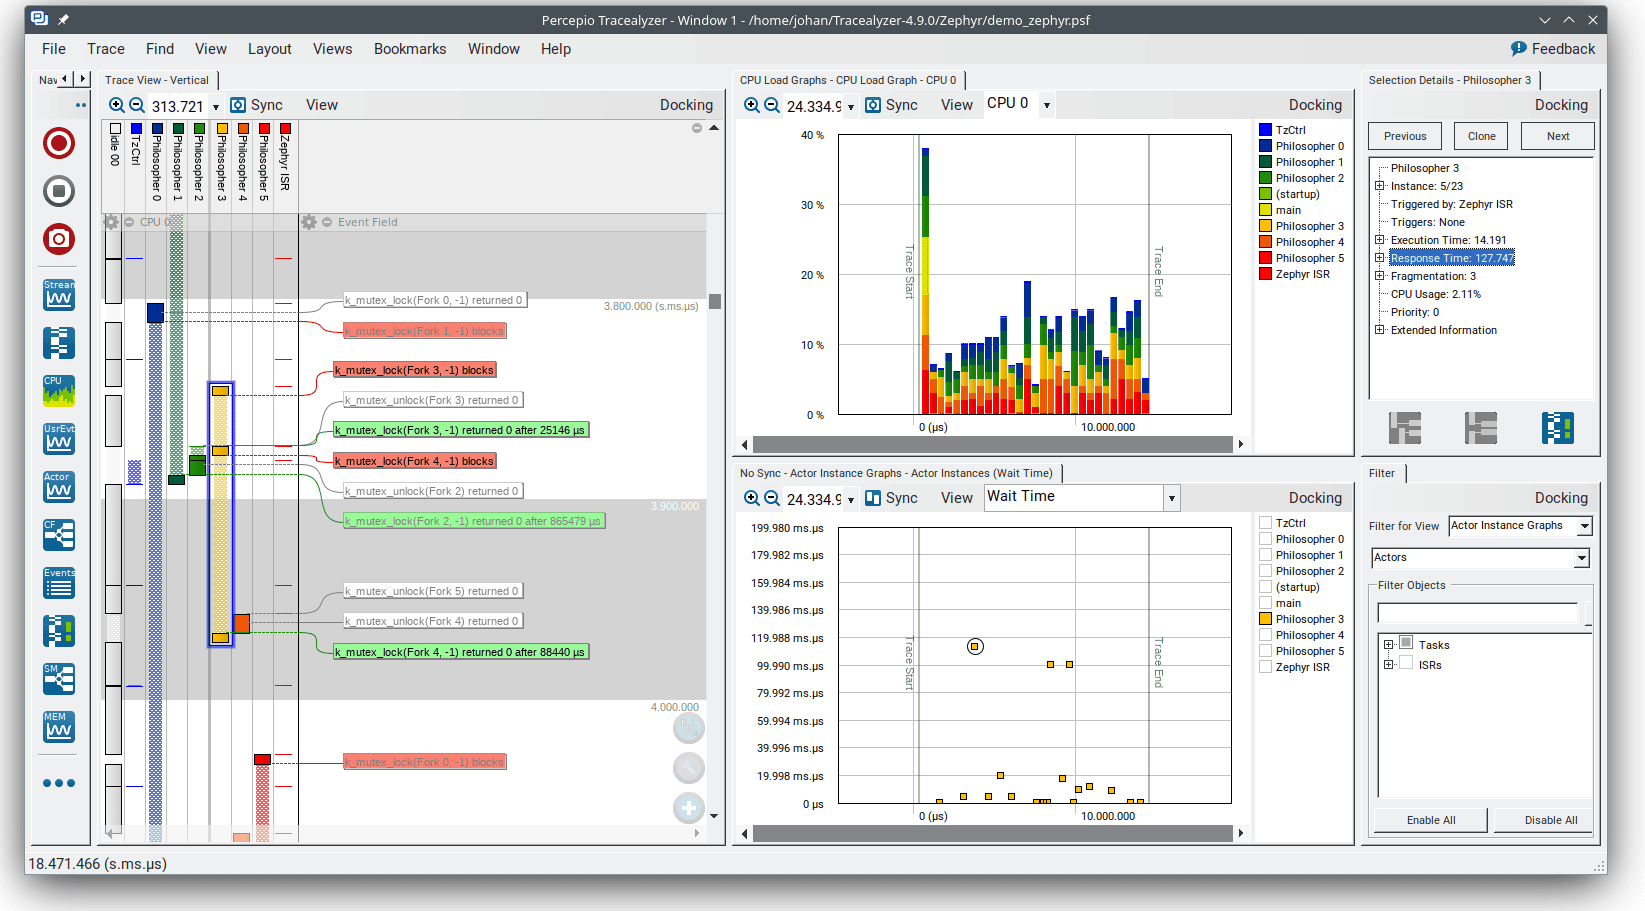
Tracealyzer offers advanced profiling features showing the events behind the numbers. Pinpoint performance bottlenecks and unlock the full potential of your hardware. Ensure you meet product performance goals and deliver a responsive user experience.
Optimization is challenging for multi-threaded RTOS or Linux systems. When a thread is slow, it is often due to factors not apparent in the source code. Visual trace observability gives the full picture and simplifies optimization.

Solve Issues Quickly
- Visualize task execution
- Spot issues and drill down
- Full system debugging

Measure Performance
- CPU load, timing variations
- Analyze memory usage
- Find inefficient code

Verify Behavior
- Matching design intent?
- Best practices followed?
- Performance requirements?
Deep Observability for FreeRTOS Software
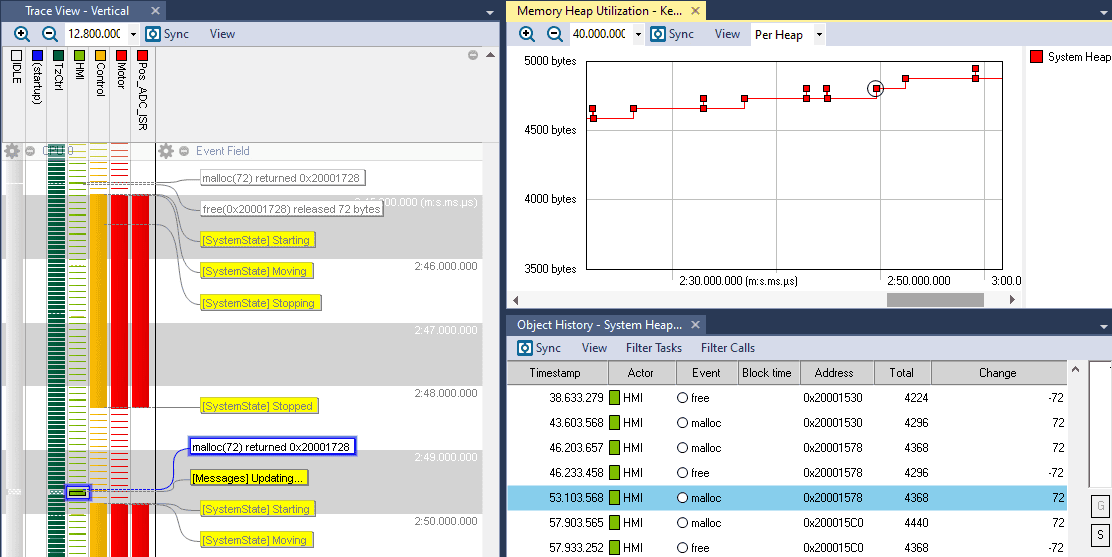
The trace view provides a detailed timeline of task scheduling and interrupts, FreeRTOS API calls as well as custom “user event” logging in the application code. This is helps you debug your code and lets you verify that your code executes as intended. You can also learn how to improve the software design for better performance.
The large set of visual overviews includes for example CPU load, task execution times, stack usage and heap memory allocation (malloc/free). Such overviews provides a profile of the resource usage over time, which helps you see the big picture, spot anomalies and optimize the system.
Trace your Tasks
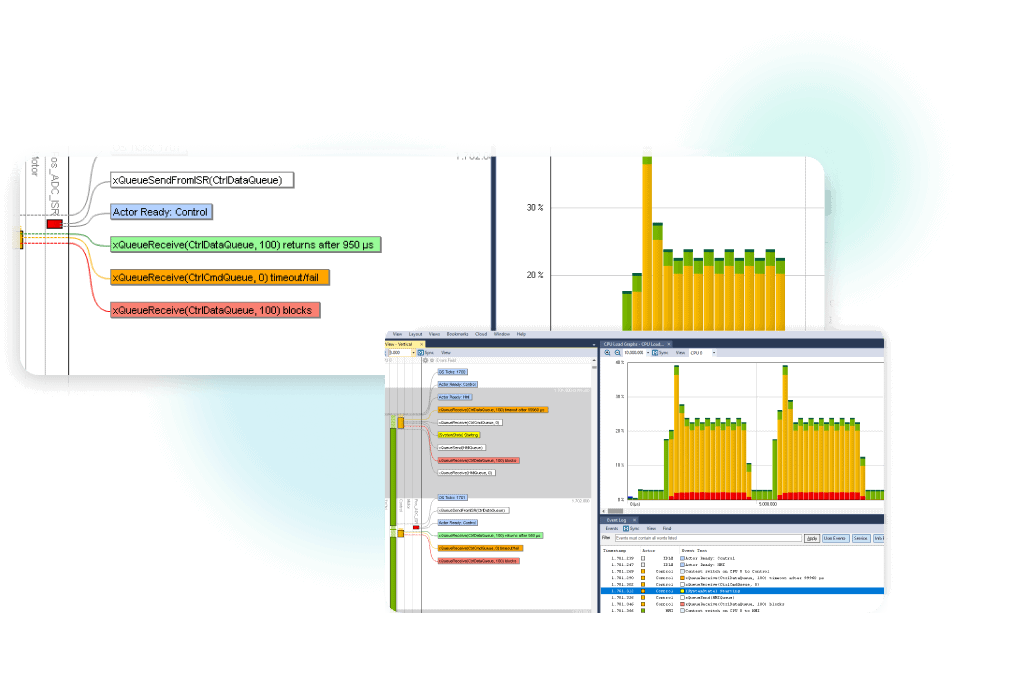
The trace view shows both the task scheduling and calls to FreeRTOS API functions. This allows you to see exactly when tasks are activated, when they actually execute, and why they sometimes don’t execute as intended. You can also see an overview showing which tasks are consuming the processor time, as shown in the “CPU Load Graph”. Detailed statistics is also available, like task execution times and response times.

Trace Kernel API Calls
Queue Events
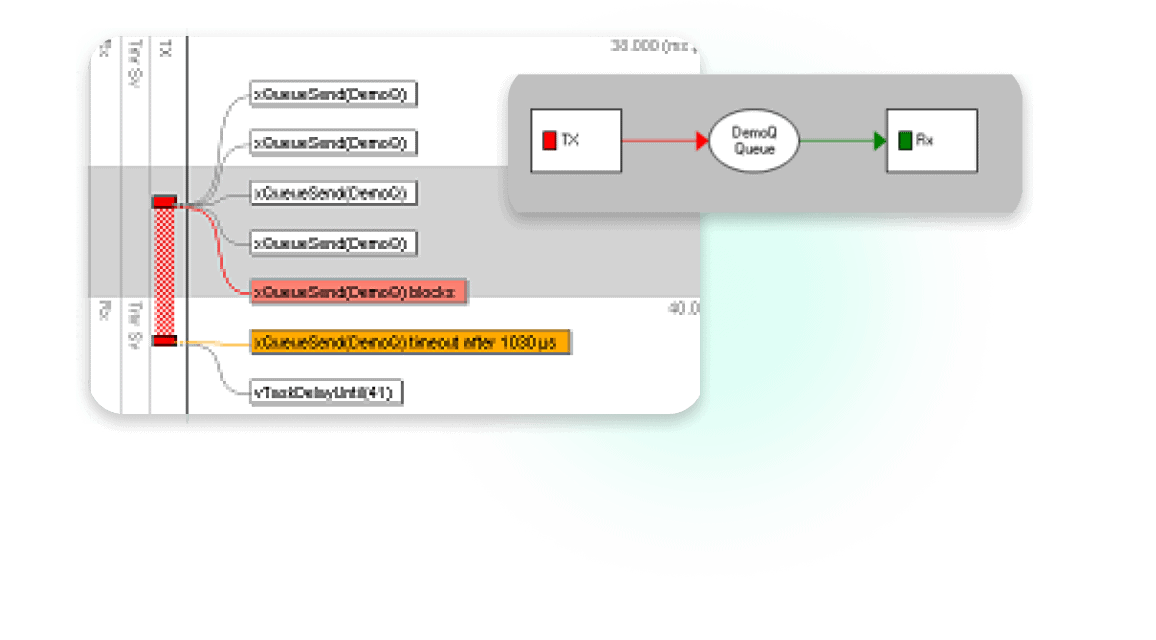
Queues allow FreeRTOS tasks to communicate by sending and receiving messages. Queues have a fixed number of slots and messages are normally buffered in FIFO order. The sender calls xQueueSend to add a message in the queue. The receiver task calls xQueueReceive to fetch the next message from the queue.
Queue operations might block if trying to send a message to a full queue, or trying to read a message from an empty queue. The screenshot shows how Tracealyzer displays queue usage and blocking. The TX task sends two messages to the queue. This wakes up the RX task (hence the green label) and it receives the two messages. Finally, the task is blocked (red label) by xQueueReceive since the queue is now empty.
The queue forms a dependency between TX and RX, that can be seen in the Communication Flow graph below. The direction of the arrows show the usage, i.e. that TX is sending to the queue and RX is receiving from it. Double-clicking on any of the nodes shows the corresponding events.
Blocking may also result in a timeout, depending on the timeout argument for xQueueReceive and xQueueSend. These are displayed as orange labels in Tracealyzer. Timeouts are possible on many FreeRTOS API calls, not just for queues, and are really important to keep track of. Some might be intentional, while other may indicate serious errors.
Semaphore Events
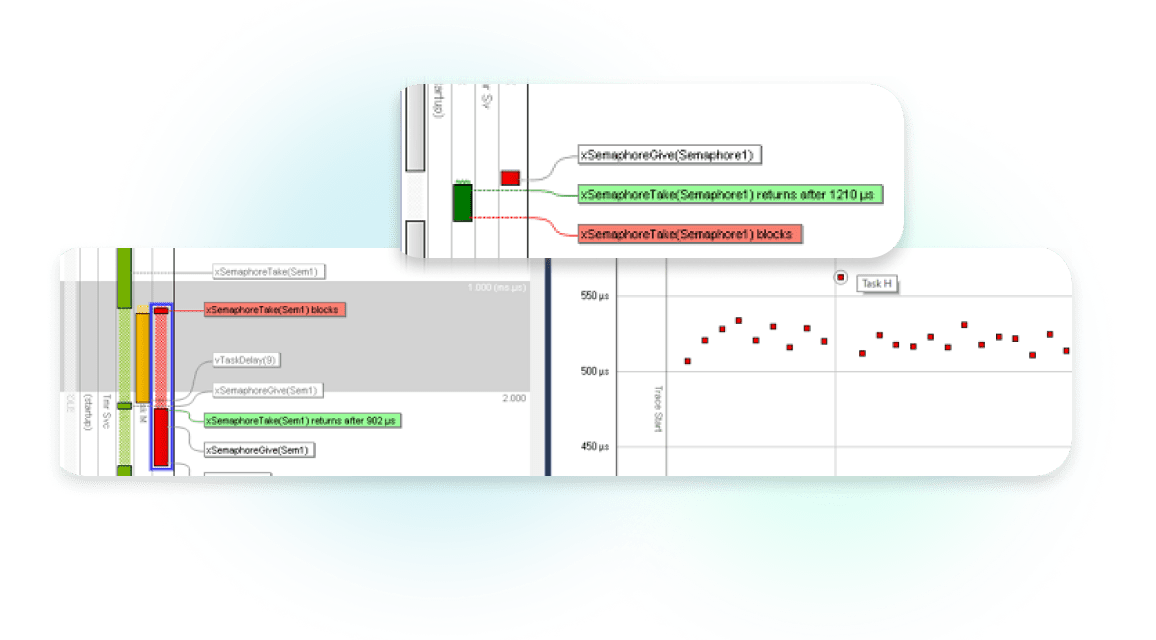
Semaphores allow for waking up tasks on a particular event. A semaphore can be regarded as a signal, which is sent by calling xSemaphoreGive and received by calling xSemaphoreTake. An example screenshot is shown below. Note that the RX task is blocked by a previous call to xSemaphoreTake and only wakes up after TX has called xSemaphoreGive.
Semaphores may also be used to protect critical sections in the code, i.e. mutual exclusion. However, when using a regular semaphore for this purpose there is a risk for priority inversion, meaning that high-priority tasks are delayed by lower-priority tasks. Tracealyzer makes it easy to spot issues like this, for example using the “Actor Instance Graph” showing the task response times.
Mutex Events
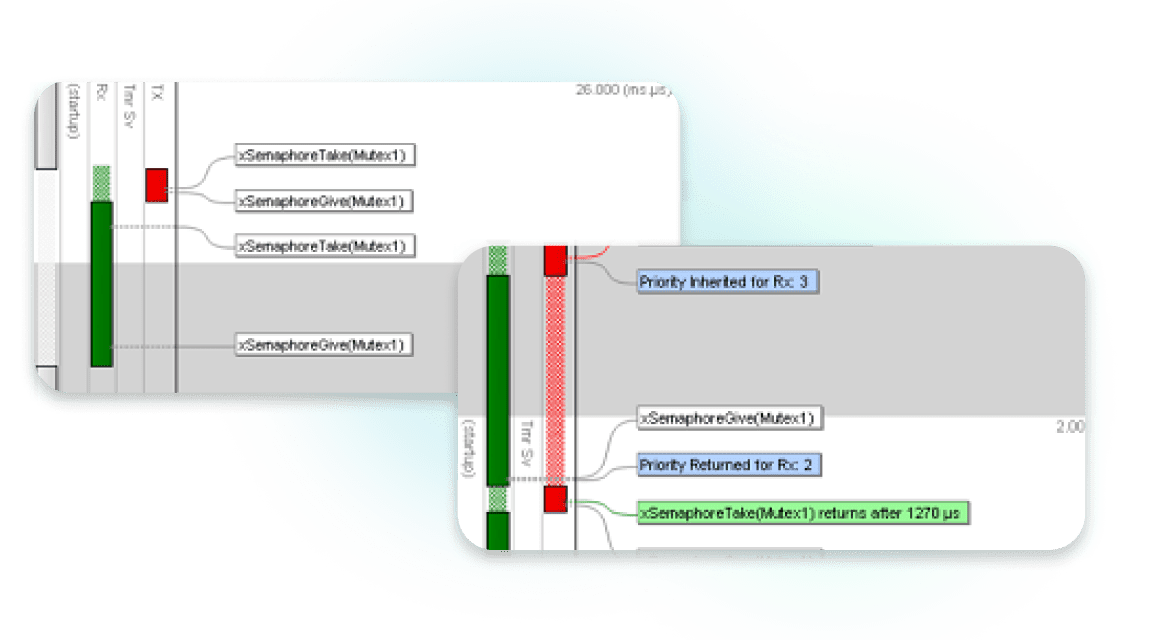
FreeRTOS offers Mutex objects to allow critical sections without the risk for priority inversion. Mutexes are used in almost the same way as semaphores and use the same API functions, xSemaphoreTake and xSemaphoreGive. However, mutexes are typically locked (taken) and released (given) in sequence and by the same task, as shown below, to provide mutual exclusion.
Mutex objects implement the priority inheritance protocol to avoid priority inversion. The below example shows how Mutexes appear in Tracealyzer. The blue labels show the priority inheritance, where the priority of the holding task is raised (inherited) to the same level as the waiting task to avoid unsuitable preemptions.
This trace view, combined with a large set of visual overviews, makes it easy to understand the real-time behavior of your FreeRTOS system. You can verify that task priorities are suitable and that the system works as designed. If something seems to be wrong, you can isolate and debug the real-time behavior without halting the system, especially in combination with application logging (see below). You can also profile the system to ensure it runs in an efficient manner, so you get the most out of your hardware.
Application Logging
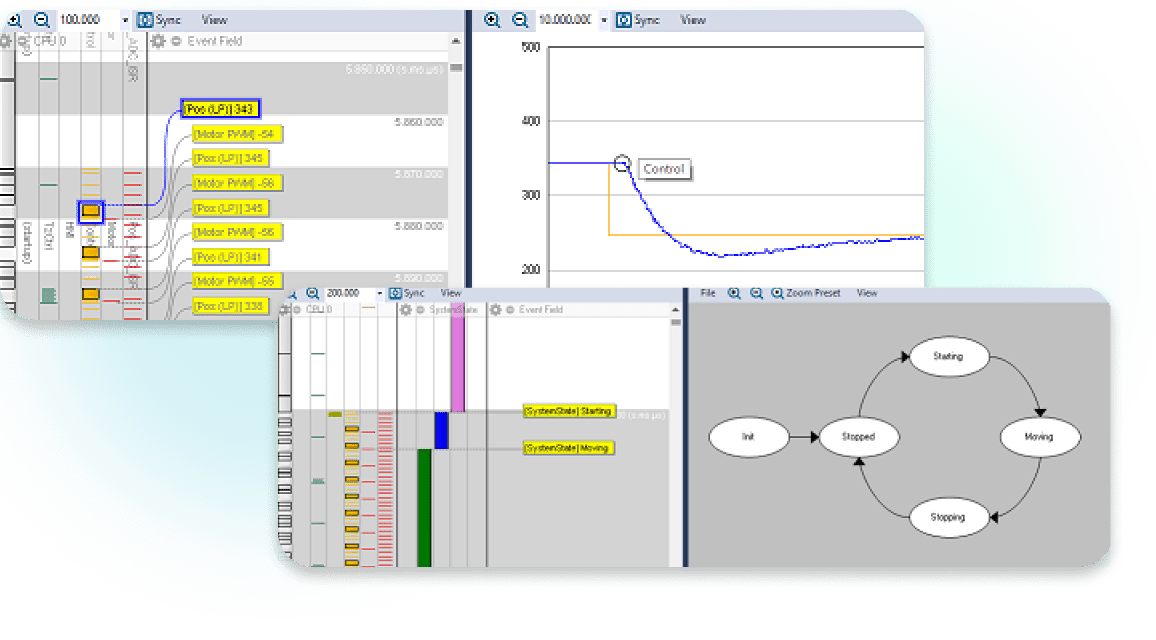
Unlike printf-calls, the Tracealyzer logging does not slow down your code by several milliseconds. The efficient logging functions can eliminate over 99% of the logging overhead compared to printf over a UART. This low-impact logging ensures you get the right picture in your debugging, without probe effects from slow logging calls.
For example, state transitions can be logged and displayed in a “logic analyzer” view and as a state diagram. The result can be shown within the trace view (as shown on the left) or summarized as a state graph (on the right), making it easy to spot incorrect behavior.
Learn more how Tracealyzer simplifies debugging with advanced, low-impact logging capabilities.
How it works
Tracealyzer for FreeRTOS relies on the Percepio TraceRecorder, included with the application and also available on Github under the Apache 2.0 license. This is integrated in your project within a few minutes by following the Getting Started guides.
Stay informed.
Sign up for our newsletter.
Our Products
Percepio® is the leading provider of observability tools for embedded and IoT software systems in development, in testing, and in the field.
TRACEALYZER
Percepio® Tracealyzer combines software tracing with powerful visualizations, allowing users to spot and analyze issues in software recordings during development and testing.
DETECT
With Detect, Percepio’s newest observability tool, you can bridge the siloed views in development, test and maintenance of deployed products. Optional CI integration allows for automated collection of issues and metrics into your existing CI pipeline.

