Tracealyzer for Cesiµm RTOS
Tracealyzer gives an unprecedented insight into the run-time world of Cesiµm RTOS systems. Solve problems in a fraction of the time otherwise needed, develop more robust designs and find new ways to improve your software’s performance.

Visualizing Runtime Behavior with
Tracealyzer for Cesiµm RTOS
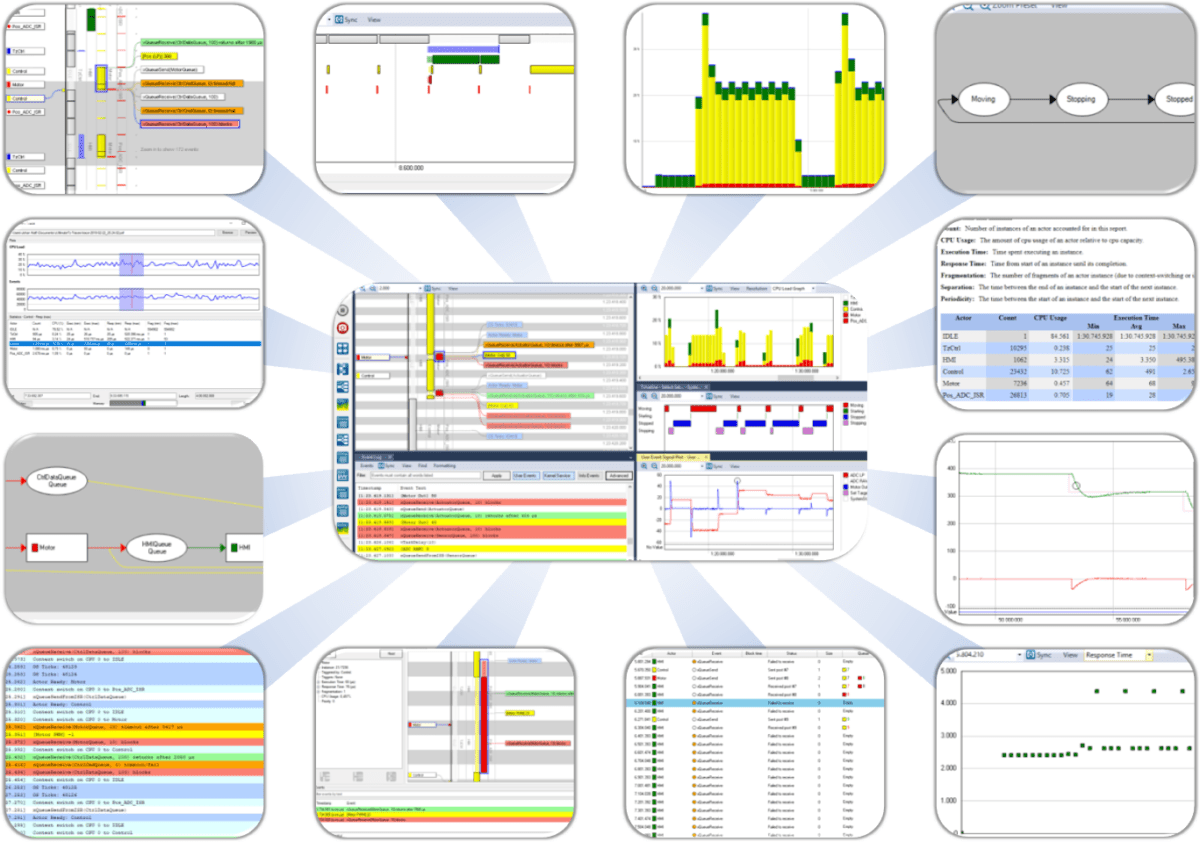
Tracealyzer for Cesiµm RTOS visualizes run-time behavior of your Cesiµm RTOS system through 25+ graphical views that complement the debugger’s low-level perspective with the big picture. The views are interconnected in clever ways and very intuitive to use. Tracealyzer gives you a new level of insight into your system at runtime, which gives several benefits in your product development.
The visualization is based on traces from a lightweight software recorder that hooks into the operating system, so you don’t need any special trace debugger to use Tracealyzer. This makes Tracealyzer more than just a lab tool, as the recording can deployed in field use. Some of our customers have the recording active by default in the release build, and thereby get very valuable trace diagnostics on real-world issues, that otherwise would have been hard to analyze.
Tracealyzer for Cesiµm RTOS relies on a trace recorder integration developed and supported by Weston Embedded.
Tracealyzer offers two types of recording, snapshot recording where the trace data is kept in a target-side RAM buffer until explicitly uploaded, and also a streaming recording where the data is transferred continuously to the host PC, allowing for practically unlimited trace durations. Streaming is currently supported via SEGGER J-Link probes, via network connections (TCP/IP) and using custom setups, e.g., streaming to an SD-card. Snapshot recording works with essentially any debugger, since Tracealyzer can extract the trace from a basic RAM dumps in .bin or .hex format.
The 25+ views include:
Cesiµm RTOS
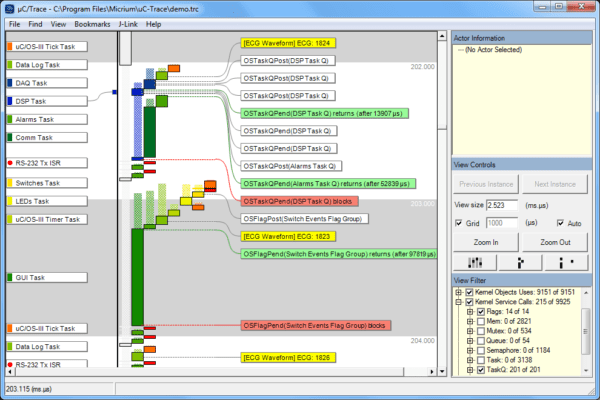
Trace of Tasks, ISRs, RTOS calls and User Events
Cesiµm RTOS
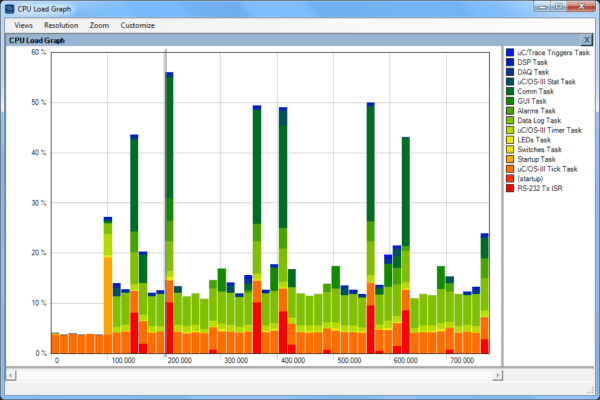
CPU Load
Cesiµm RTOS
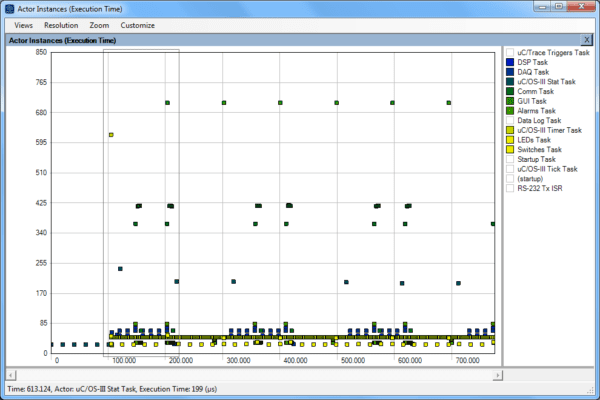
Task Timing Variations
Cesiµm RTOS
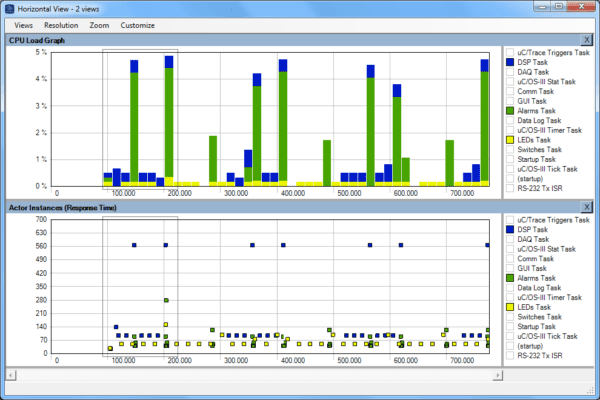
Multiple Views Synchronized
Cesiµm RTOS
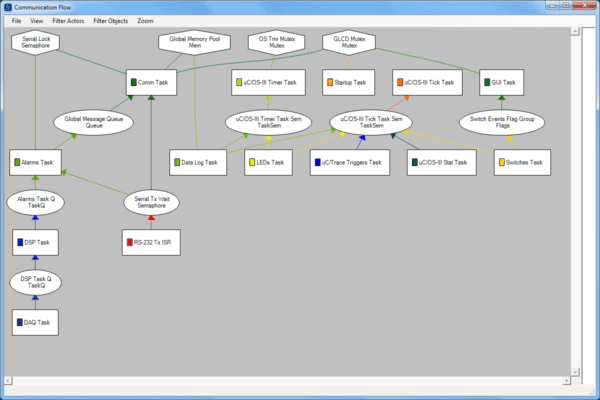
Communication Flow
Cesiµm RTOS
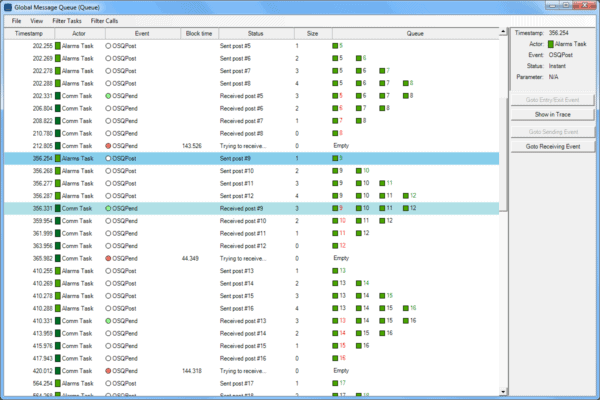
Kernel Object History
Cesiµm RTOS
Create your own User Events
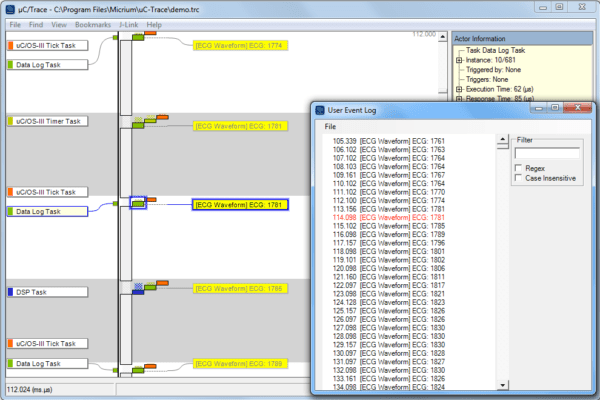
User-defined events, or User Events, allows you to log any event or data in your embedded application. This gives the flexibility of classic debug “printf” calls, but are much faster as all string formatting is done offline, in the viewer. Since you get the events on the same time-line as the kernel trace, it is easy to correlate the application event with the other views.
Cesiµm RTOS
Visualize data from your code
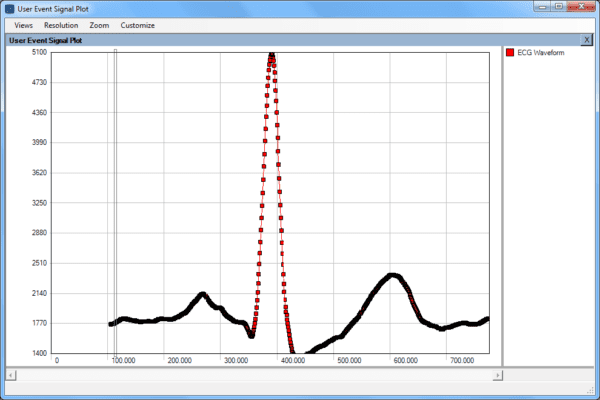
The plotting is highly useful for analysis of control algorithms, as it allows you to correlate the plotted data with the other time-line views to find the cause of any anomalies in the plot.
Information on licensing and pricing is found on the Licensing page and local distributors are listed on the Partners page.
In case you have any technical questions, don’t hesitate to contact support@percepio.com.
Stay informed.
Sign up for our newsletter.
Our Products
Percepio® is the leading provider of observability tools for embedded and IoT software systems in development, in testing, and in the field.
TRACEALYZER
Percepio® Tracealyzer combines software tracing with powerful visualizations, allowing users to spot and analyze issues in software recordings during development and testing.
DETECT
With Detect, Percepio’s newest observability tool, you can bridge the siloed views in development, test and maintenance of deployed products. Optional CI integration allows for automated collection of issues and metrics into your existing CI pipeline.

