Tracealyzer with Linux Tracing Support
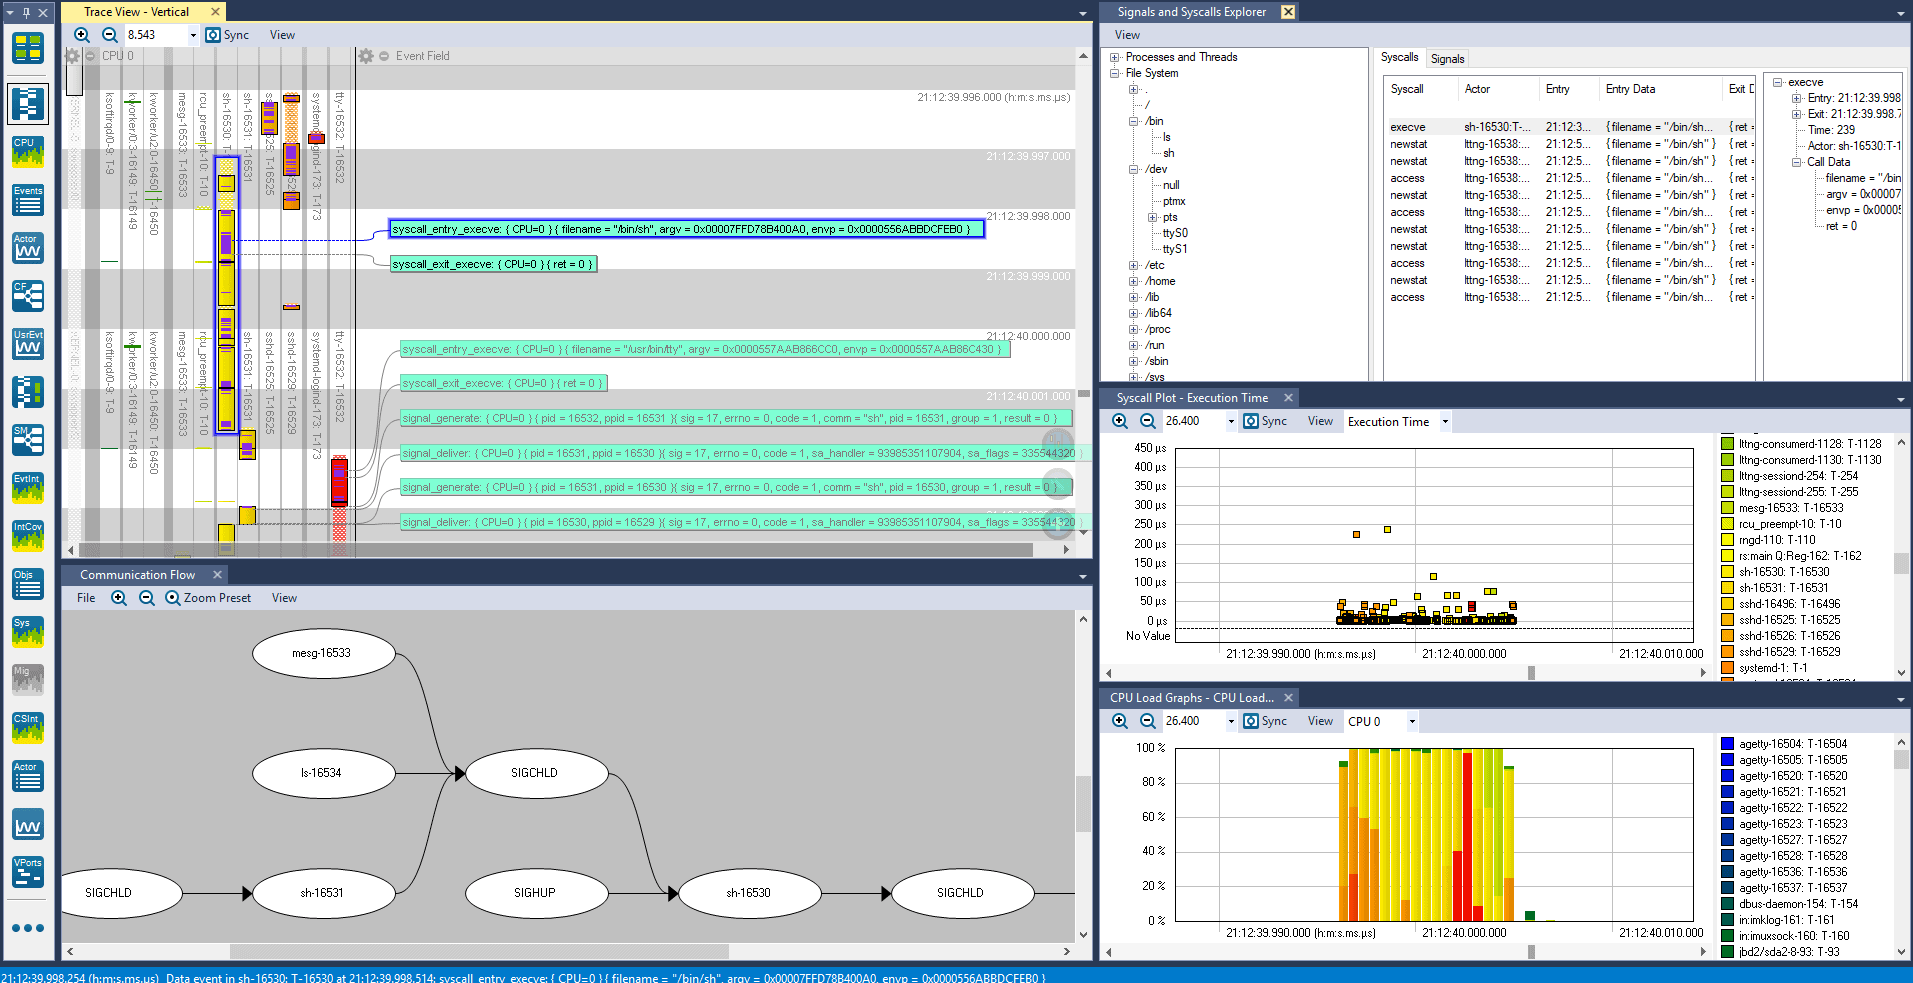
Tracealyzer with improved Linux® tracing and analysis support is available from our download page, and it comes with an evaluation license valid for 10 days. Read more about the Linux support in Tracealyzer below, as well as on this Getting Started page.

This release combines the latest generation Tracealyzer with significant improvements for embedded Linux tracing and visualization. This includes:
- Visual Trace Diagnostics for Linux – Easily spot anomalies in visual overviews and zoom in on the bugs like never before.
- Rich set of high-level overviews for top-down exploratory analysis, including process interactions, parent/child process dependencies, CPU usage, RAM usage, I/O usage, file usage, state machines and user-defined metrics.
- Powerful yet intuitive trace view for showing the details, scalable for large Linux traces with respect to both responsiveness and clarity. This has been optimized for Linux traces and now includes process trees, forking and system calls.
- The Signals and Syscalls Explorer, which is like an index over the trace, showing how each thread, process and process tree interacts with the Linux kernel through syscalls, and how signals are generated and delivered.
- The Communication Flow view has been optimized for Linux and shows a visual graph over the process interactions with respect to file descriptors, signals and pipes.
- An Actor Tree field in the main trace view lets you see how processes and threads are spawned over time, including their parent/child relations.
- A Modern and Flexible User Interface – Customize the window layout and have the right information available on-screen to facilitate analysis. Save and load multiple layouts to suite each use-case.
- User-defined Advanced Analysis – Adapt Tracealyzer to specific use cases via customizable event interpretation, user-defined data sets such as Intervals and State machines and display in highly configurable views.
- Open Standards – Leverages CTF, the Common Trace Format, using the widely supported LTTng open source tracing framework.
LTTng supports both kernel and user-space tracing (UST), and it can be used with Linux kernel versions from v2.6.32 and forwards. From v2.6.38 it does not require any kernel patches. This is a pure software solution, so no extra hardware is needed to use Tracealyzer. The LTTng user-space tracer allows you to insert tracepoints anywhere in your application and you can even instrument standard library calls without modifying the library source code. Tracealyzer allows you to configure how each tracepoint should be interpreted, as a service call or general user event, parameters, formatting, et cetera.
Information on licensing and pricing is found on the Licensing page and local distributors are listed on the Partners page.
In case you have any technical questions, don’t hesitate to contact support@percepio.com.
Stay informed.
Sign up for our newsletter.
Our Products
Percepio® is the leading provider of observability tools for embedded and IoT software systems in development, in testing, and in the field.
TRACEALYZER
Percepio® Tracealyzer combines software tracing with powerful visualizations, allowing users to spot and analyze issues in software recordings during development and testing.
DETECT
With Detect, Percepio’s newest observability tool, you can bridge the siloed views in development, test and maintenance of deployed products. Optional CI integration allows for automated collection of issues and metrics into your existing CI pipeline.


