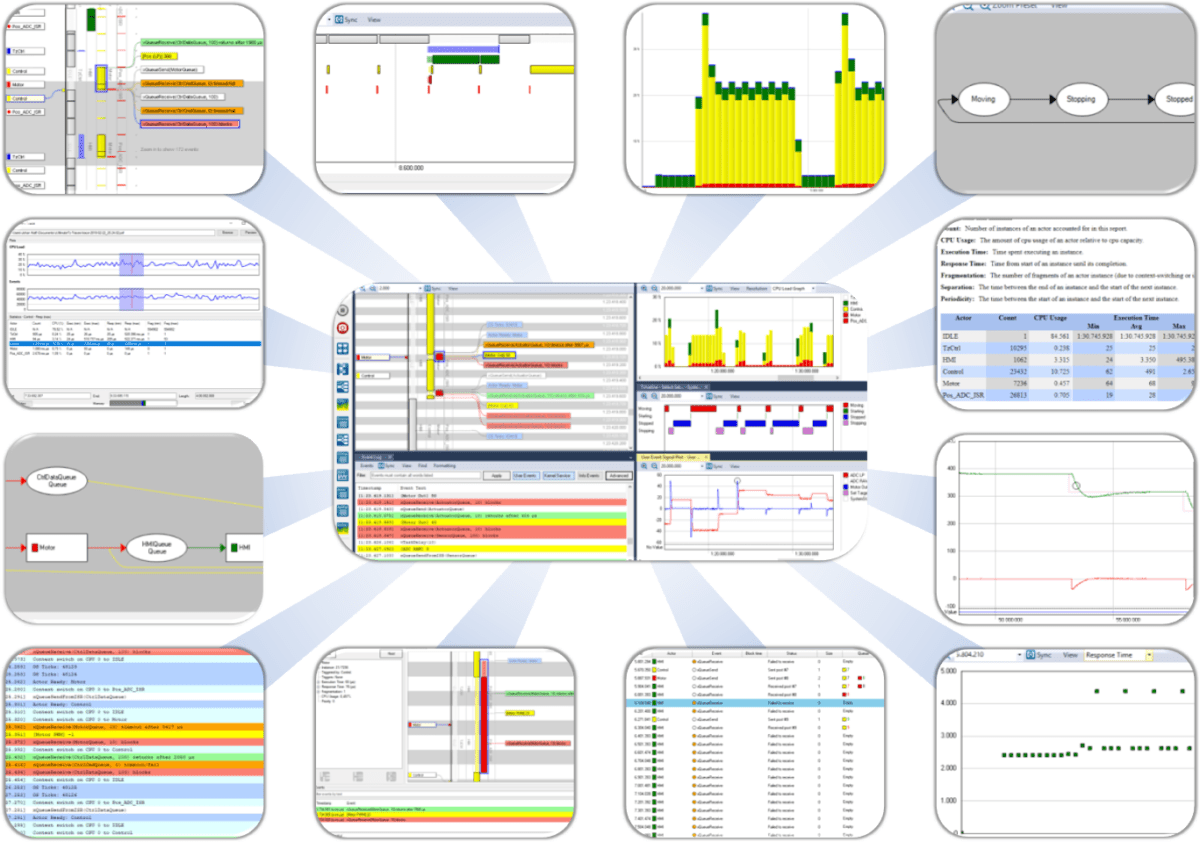
When working with an RTOS, you have probably noticed that a traditional debugger often is insufficient for many types of problems. Your debugger shows the current system state, e.g., when stopping on a breakpoint, but how did the system reach this state? What does the task timing look like, how much of the CPU time is used, and by what tasks? And what is actually going on in the run-time system?
Tracealyzer visualizes recordings of RTOS events as well as selected events from your application. This is explained through more than 25 graphical views, that are interconnected and intuitive to use. Tracealyzer can be used as a lab tool during debug sessions, or deployed as a crash recorder in field testing or post-release, as long as there is storage available on the device.
Tracealyzer shows you the big picture with high-level, interconnected views that complement the detailed debugger view. You may have used a trace tool before, but this is something extra. We are unique in focusing on trace visualization and have put years of dedication and passion for the subject into this tool, featuring 25+ innovative views with different perspectives of the trace. With the release of Tracealyzer 4 for On Time RTOS-32, we have added an improved GUI and the ability to do custom analysis: define and trace your own software events, and construct intervals and state machines from those events.
All Tracealyzer views are designed to be intuitive to read, and they are interconnected – you click in one view to open or focus another view on the clicked location.
Tracealyzer for On Time RTOS-32 is best experienced live, so download and try it now – each download comes with a free, time-limited evaluation license and a demo trace to quickly get you started. The various licensing options are available here.
Tracealyzer for On Time RTOS-32 uses the kernel trace feature already available in On Time RTOS-32, which normally generates text files. Percepio provides a utility for exporting the internal trace data to an XML document that is then opened in Tracealyzer.
Read more about the Trace Exporter here.
Stay informed.
Sign up for our newsletter.
Our Products
Percepio® is the leading provider of observability tools for embedded and IoT software systems in development, in testing, and in the field.
TRACEALYZER
Percepio® Tracealyzer combines software tracing with powerful visualizations, allowing users to spot and analyze issues in software recordings during development and testing.
DETECT
With Detect, Percepio’s newest observability tool, you can bridge the siloed views in development, test and maintenance of deployed products. Optional CI integration allows for automated collection of issues and metrics into your existing CI pipeline.


