Tracealyzer and IAR Embedded Workbench


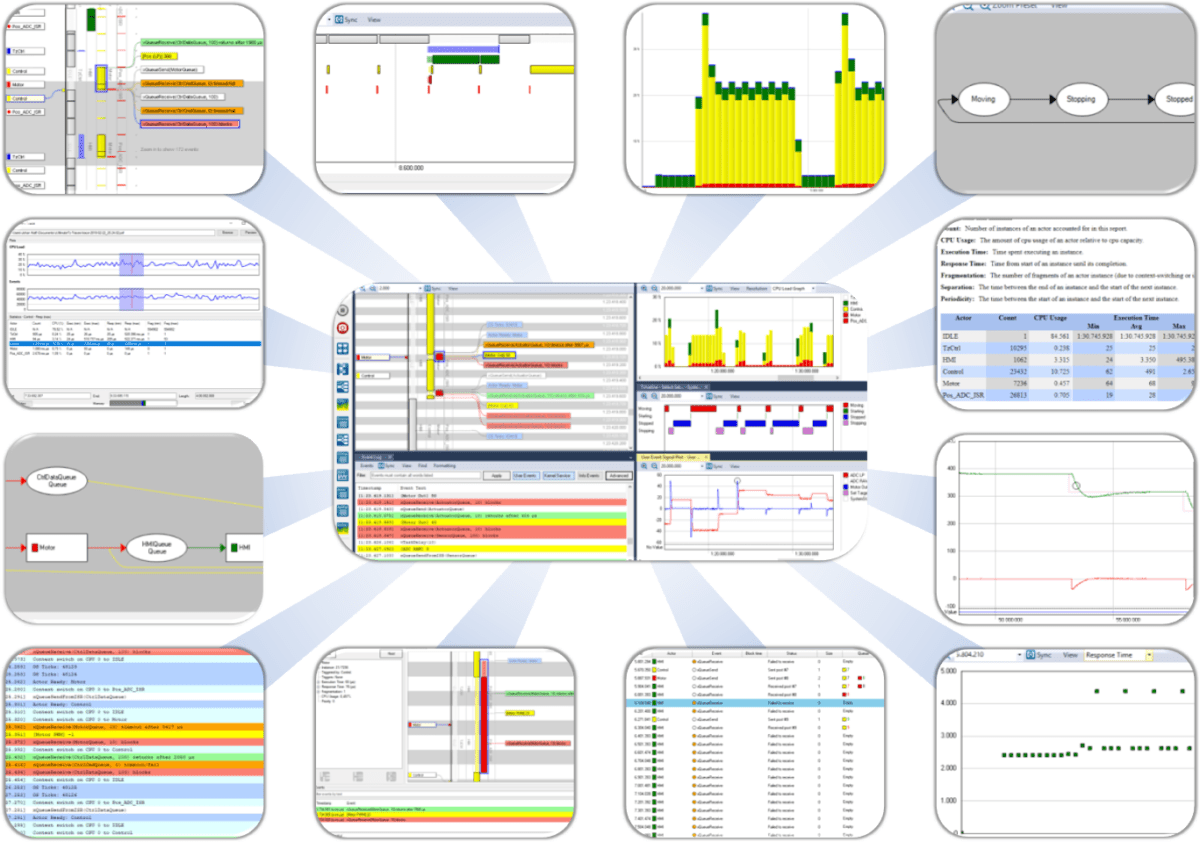
When developing embedded software based on a real-time operating system (RTOS), a good understanding of the runtime behavior can save you many valuable hours when debugging and validating your application. Tracealyzer is an advanced software tracing tool designed for RTOS-based applications and provides more than 30 graphical views of the real-time behavior, making it easier reveal errors and bottlenecks. The views are interconnected in clever ways and very intuitive to use. With Tracealyzer you increase development efficiency and deliver robust, responsive software, on time and within budget.
To learn more about how Tracealyzer can be used in practice, check out the blogs and white papers on Resources.
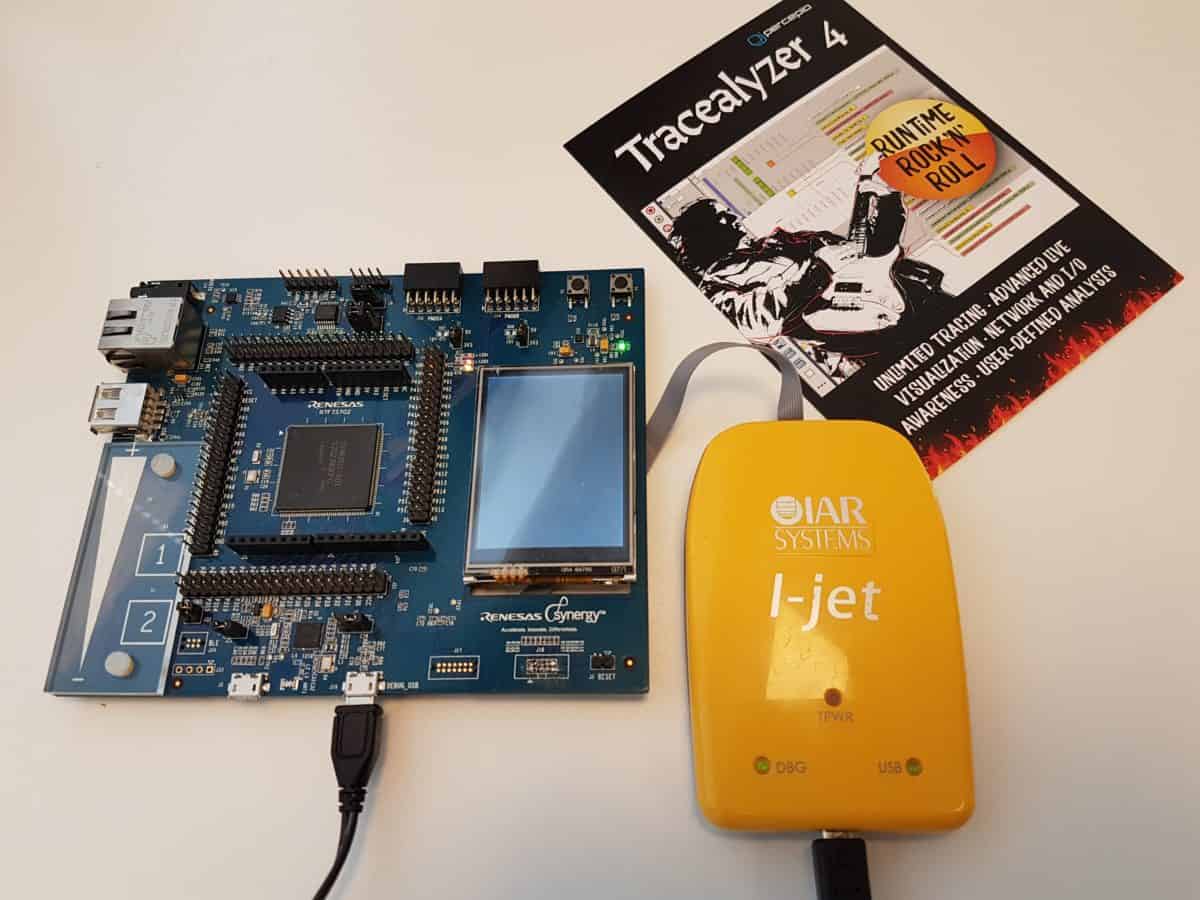
Tracealyzer uses software-based tracing, so no special tracing hardware is required. However, we recommend using an IAR I-Jet probe to allow for fast trace streaming, although streaming is also possible in other ways.
Streaming Mode
Streaming via IAR Embedded Workbench and I-Jet probes is supported for Arm Cortex-M devices since Tracealyzer v4.1.5, which allow IAR users to fully benefit from the powerful capabilities of Tracealyzer 4. This way, you can record long traces and without needing a big RAM buffer. This leverages the ITM module found on most Arm MCUs. With a fast debug probe like IAR I-Jet, ITM allows for high data rates and low tracing overhead.
Start by following the general getting started guide corresponding to your RTOS, in order to integrate the trace recorder library.
Then read Percepio Application Note PA-023 to learn how to use setup Tracealyzer and IAR Embedded Workbench for ITM streaming.
This video below shows how it is used in practice.
Snapshot Mode
In this mode, the software events are stored in a on-target RAM buffer. The IAR debugger can be configured to save the trace buffer to a file for Tracealyzer. Snapshots are useful when streaming isn’t possible, for example on production devices without debug ports, and can be used within our DevAlert monitoring solution.
When using Tracealyzer 4.6 or newer, snapshots is supported by the streaming implementation by selecting the “RingBuffer” stream port.
Start by following the general getting started guide corresponding to your RTOS, in order to integrate the trace recorder library.
Make sure to select the “RingBuffer” stream port by adding “/streamports/RingBuffer/include” in your include paths and the .c files found in “/streamports/RingBuffer/” in your build. Make sure no other version of trcStreamPort.h is included from other stream port folders.
Note that the “streaming” option should still be used in trcKernelPortConfig.h (TRC_CFG_RECORDER_MODE), also for snapshot mode. The “snapshot” option is a legacy solution that ONLY supports snapshot mode, while the (default) “streaming” option actually support both modes and is recommended for new users.
Then follow these steps to configure IAR Embedded Workbench:
- Download save_trace_buffer.mac. This IAR macro file will save the contents of the trace buffer to a host file.
- Add the macro file under Options -> Debugger -> Use Macro File(s).
- Check that the macro is correctly included. When in a debug session, open View -> Macros -> Debugger Macros and look for “save_trace_buffer”.
- Saving a trace can now be done in three ways:
- Manually: In the “Debugger Macros” view, right-click on your macro and select “Add to Quicklaunch window”. Double-click on the “refresh” icon in the Quicklaunch window to save the trace.
- On a breakpoint: Place a breakpoint in the code and open it in the breakpoint editor. Enter your macro name (e.g., “save_trace_buffer()”) in the Action -> Expression field. The trace is now saved every time that breakpoint is hit.
- On every halt: Rename the “save_trace_buffer” function to execUserExecutionStopped(). That is a special hook that is called every time the execution is halted. This is however called also when single-stepping and can make it slower.
Adding Tracealyzer to the Tools menu
To enable quick access to Tracealyzer, you may include a shortcut to Tracealyzer in the “Tools” menu.
- In the IAR “Tools” menu, select “Configure Tools…”
- Add a new entry, e.g., “Tracealyzer”
- Set the path to the Tracealyzer executable (the “.exe” file).
- If using snapshot mode, you can set the argument to “$PROJ_DIR$\trace.hex” to make it open the latest saved trace automatically.
