When using Percepio Tracealyzer and TraceRecorder, you may have noticed that thread names show up automatically, while other kernel objects (like queues or semaphores) are only displayed as hexadecimal numbers. But in the demo traces, all kernel objects have proper...
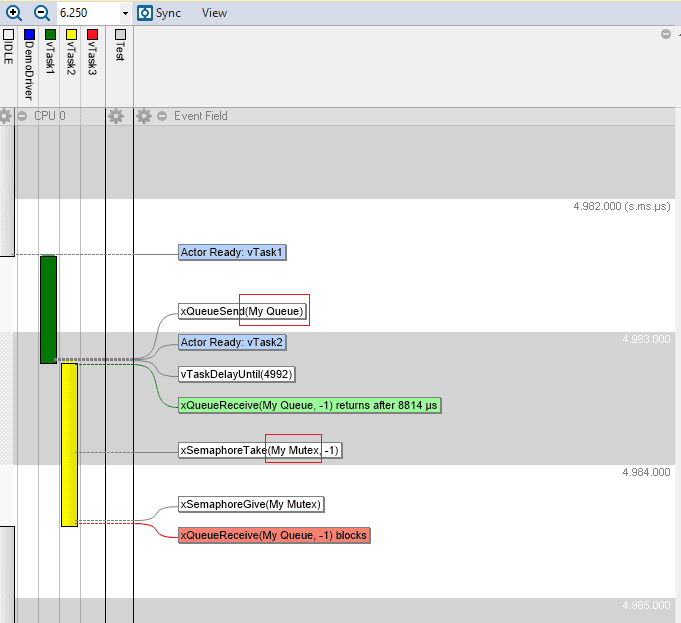
Naming your kernel objects
read more