Västerås, Sweden, 17th June 2020 * * * Percepio, the leader in visual trace diagnostics for embedded systems and IoT, announces an open beta test program for the upcoming Tracealyzer version 4.4, which provides much improved support for visualization and analysis of embedded Linux® software, packaged in an intuitive and modern user interface. The beta program runs until 1 August 2020, and anyone interested in participating can download Tracealyzer with embedded Linux support from percepio.com now. A free 45-day evaluation license is included in the program, and all participants also qualify for exclusive discounted offers on Tracealyzer licenses up until 1 August.
Tracealyzer 4.4 with Linux tracing support transforms low-level trace data into a rich set of overviews enabling top-down exploratory analysis, making it easy to spot anomalies and drill down to see the details. This avoids many hours of frustrating guesswork, providing faster solutions and a much higher level of confidence during debugging, verification and performance optimization.
The list of Linux-oriented improvements includes:
- Visual Trace Diagnostics for Linux – Easily spot anomalies in visual overviews and zoom in on the bugs like never before.
- Rich set of high-level overviews for top-down exploratory analysis, including process interactions, process forking, CPU usage, RAM usage, I/O usage, file usage, state machines and user-defined metrics.
- Powerful yet intuitive trace view for showing the details, scalable for large Linux traces with respect to both responsiveness and clarity. This has been optimized for Linux traces and now includes process trees, forking and system calls.
- A Modern and Flexible User Interface – Customize the window layout and have the right information available on-screen to facilitate analysis. Save and load multiple layouts to suite each use-case.
- User-defined Advanced Analysis – Adapt Tracealyzer to specific use cases via customizable event interpretation, user-defined data sets such as Intervals and State machines and display in highly configurable views.
- Open Standards – Leverages CTF, the Common Trace Format, using the widely supported LTTng tracing framework.
Percepio CEO and founder Dr. Johan Kraft comments: “There is a tremendous potential to improve embedded software development via better insight into the runtime system, especially for complex software systems based on Linux. For embedded application developers to really benefit from software tracing in everyday development, proper tools for visual trace diagnostics are key as these tools allow developers to quickly make sense of large software traces, identify bugs and verify solutions.
We’ve developed Tracealyzer to make visual trace diagnostics simple and a natural part of everyday development, yet also allowing for more advanced analyses of application-specific concerns. Tracealyzer has been very appreciated among RTOS software developers and we are thrilled to now offer an even better Tracealyzer for embedded Linux developers.”
Beta program details
The beta program is open now and will be available until 1 August 2020. To participate in the beta test, download Tracealyzer with embedded Linux support from percepio.com. Tracealyzer 4.4 will be released in Q3, 2020.
The full release is here | German
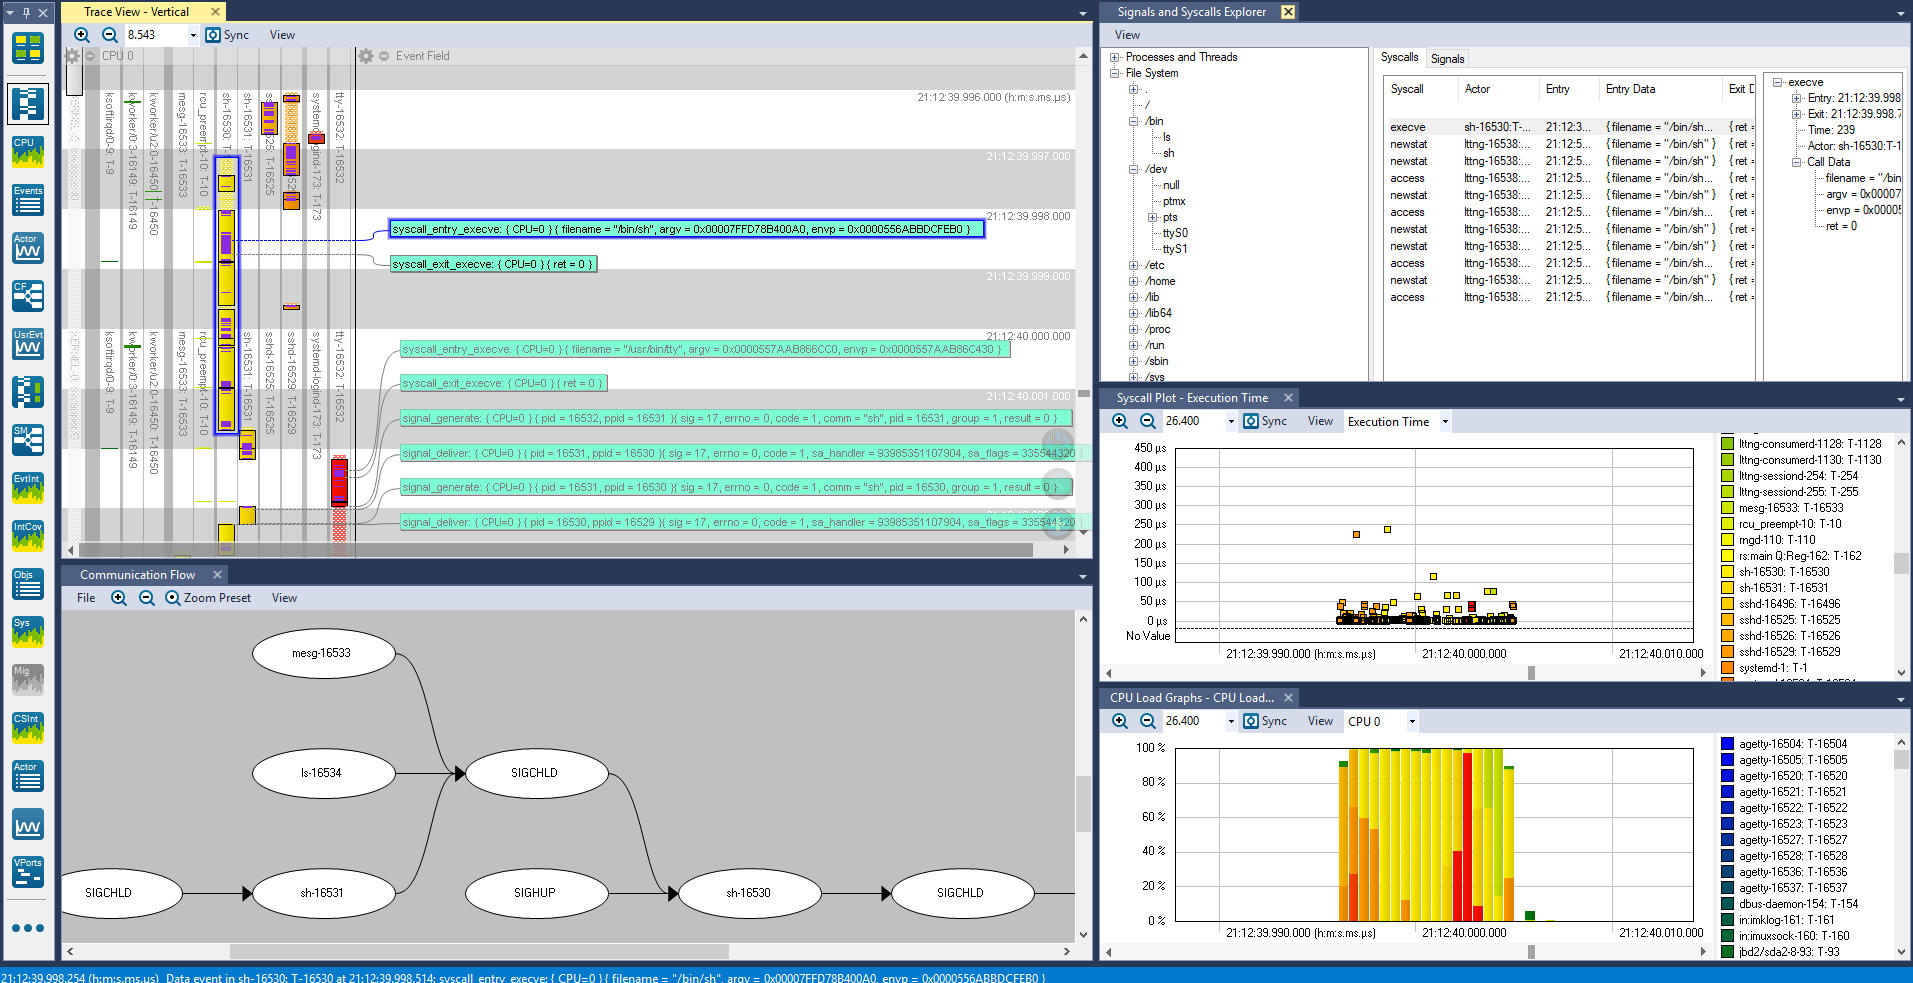
Screenshot, with caption:
Features highlighted in this screenshot are:
– Syscalls shown in trace, as “overlays” (purple sections within task fragments)
– Plot of syscall execution time
– Signals shown in Communication flow graph
– Signals and Syscalls Explorer – an index where files and processes are used.