Tracing of “runnables” is a fairly new feature in Percepio Tracealyzer, added in v4.7.0. One of our automotive customers needed this feature to make ISO 26262 certification of their Electronic Control Unit (ECU) software easier. In order to properly allocate ECU functions to tasks and to cores, and to ensure that they meet the budgeted resources, it is useful to know execution times, response times and wait times for each task and runnable. Thus, the concept of runnables was added in Tracealyzer and TraceRecorder to collect such metrics.
Runnables is an AUTOSAR concept that corresponds to top-level functions within a task. But runnable tracing is applicable to all kind of applications, not only AUTOSAR systems, since this type of tracing can be applied to any code. For example, if you have a task with a main switch statement that executes different code depending on incoming events/commands. You can then instrument each case as a runnable and see the individual execution times for different cases/events. But note that runnables can’t be nested. Each task may only have one runnable active at a time.
To those familiar with intervals in Tracealyzer, runnables may seem similar. And indeed, runnables are implemented in Tracealyzer as a special case of intervals. The terminology is slightly different, though: intervals have Length, while runnables have Execution Time. Both have Separation and Periodicity, while runnables additionally have Response Time and Wait Time. Specifically:
| Execution Time | The time between the start and end point where the associated task is also switched in by the scheduler. |
| Response Time | The time between the start and end point. |
| Wait Time | The time between the start and end point where the associated task is NOT switched in by the scheduler. |
| Separation | The time between the end of the previous runnable and the start of the current one. |
| Periodicity | The time between the start of the previous runnable and the start of the current one. |
Before a runnable can be measured, it needs to be registered. Depending on the type of registration, the registration event needs to be present in the trace to be recognized by Tracealyzer. Registration of a runnable isn’t shown in the Trace View, but will appear in the Event Log when Raw Events are enabled.
After registration, a runnable can be started and stopped. These events are shown in the Trace View and the Event Log. Once started, a runnable will remain active until another runnable is started on the same task, or when it is stopped explicitly.
The TraceRecorder API for runnable tracing is defined in trcRunnable.h.
There are two ways to register and use runnables: statically and dynamically. Dynamic runnables are the easiest to use. Each runnable is registered separately in the target code. They can be referenced via the entry table, via constant strings or via handles (pointers).
traceResult xTraceRunnableRegister(
   const char *szName,
   TraceRunnableRegisterMethod_t uxRegisterMethod,
   TraceRunnableHandle_t *pxRunnableHandle);
Registers a single runnable. This function needs to be called on the task context that is to be starting and stopping the runnable. A “runnable register” event is sent. Parameters:
- szName: the name that will be displayed in Tracealyzer
- uxRegisterMethod: one of:
- TRC_RUNNABLE_REGISTER_METHOD_USE_ENTRY_TABLE: consumes one slot in the entry table; the handle will point to the entry; the function will fail if there isn’t enough space, in that case increase the value of TRC_CFG_ENTRY_SLOTS in trcConfig.h
- TRC_RUNNABLE_REGISTER_METHOD_USE_STRING_ADDRESS: unique string addresses will be used as handles; the handle will point to the name; the registration event must be present in the trace, it is allowed to periodically register this type of runnable
- TRC_RUNNABLE_REGISTER_METHOD_USE_HANDLE_ADDRESS: unique addresses will be used as handles; the handle will point to itself; the registration event must be present in the trace, it is allowed to periodically register this type of runnable
- pxRunnableHandle: pointer to the handle to be used.
traceResult xTraceRunnableStart(TraceRunnableHandle_t xRunnableHandle);Indicates that the specified runnable has started. A “runnable start” event is sent. In the event log, it will be shown as
“<task name> started executing <runnable name>”.
traceResult xTraceRunnableStop(void);Indicates that the currently active runnable has stopped. A “runnable stop” event is sent. In the event log, it will be shown as
“<task name> stopped executing runnable”.
Static runnables consume less resources on the target. Their names don’t reside on the target but are predefined in one or more XML files that reside on the host computer, in one of the directories for external dependencies. See the section ‘Runnable Tracing’ in the User Manual for examples on how to create such XML files. Each XML file represents a named “runnable set”. A task can register multiple sets, as long as the same set isn’t registered by another task. Internally, static runnables are implemented through Tracealyzer’s extension mechanism, which dynamically allocates event IDs. Also see trcExtension.h.
traceResult xTraceRunnableRegisterStaticSet(
   const char *szName,
   uint8_t uiMajor,
   uint8_t uiMinor,
   uint16_t uiPatch,
   uint32_t uiRunnableCount,
   TraceRunnableStaticSetHandle_t *pxRunnableSetHandle);
Registers the specified runnable set. This instructs Tracealyzer to look for a file “<name>-v<major>-<minor>-<patch>.xml”. An “extension create” event is sent. Parameters:
- szName: the name of the set
- uiMajor, uiMinor, uiPatch: the version number
- uiRunnableCount: the number of runnables in this set
- pxRunnableSetHandle: pointer to the handle to be used
traceResult xTraceRunnableStartStatic(
   TraceRunnableStaticSetHandle_t xRunnableSetHandle,
   uint32_t uiRunnableId);
Indicates that the specified runnable has started. A “runnable start” event is sent. In the event log, it will be shown as
“<task name> started executing <runnable name>”. Parameters:
- pxRunnableSetHandle: the runnable set’s handle
- uiRunnableId: index of the runnable in the set
traceResult xTraceRunnableStopStatic(void);Indicates that the currently active runnable has stopped. A “runnable stop” event is sent. In the event log, it will be shown as
“<task name> stopped executing runnable”.
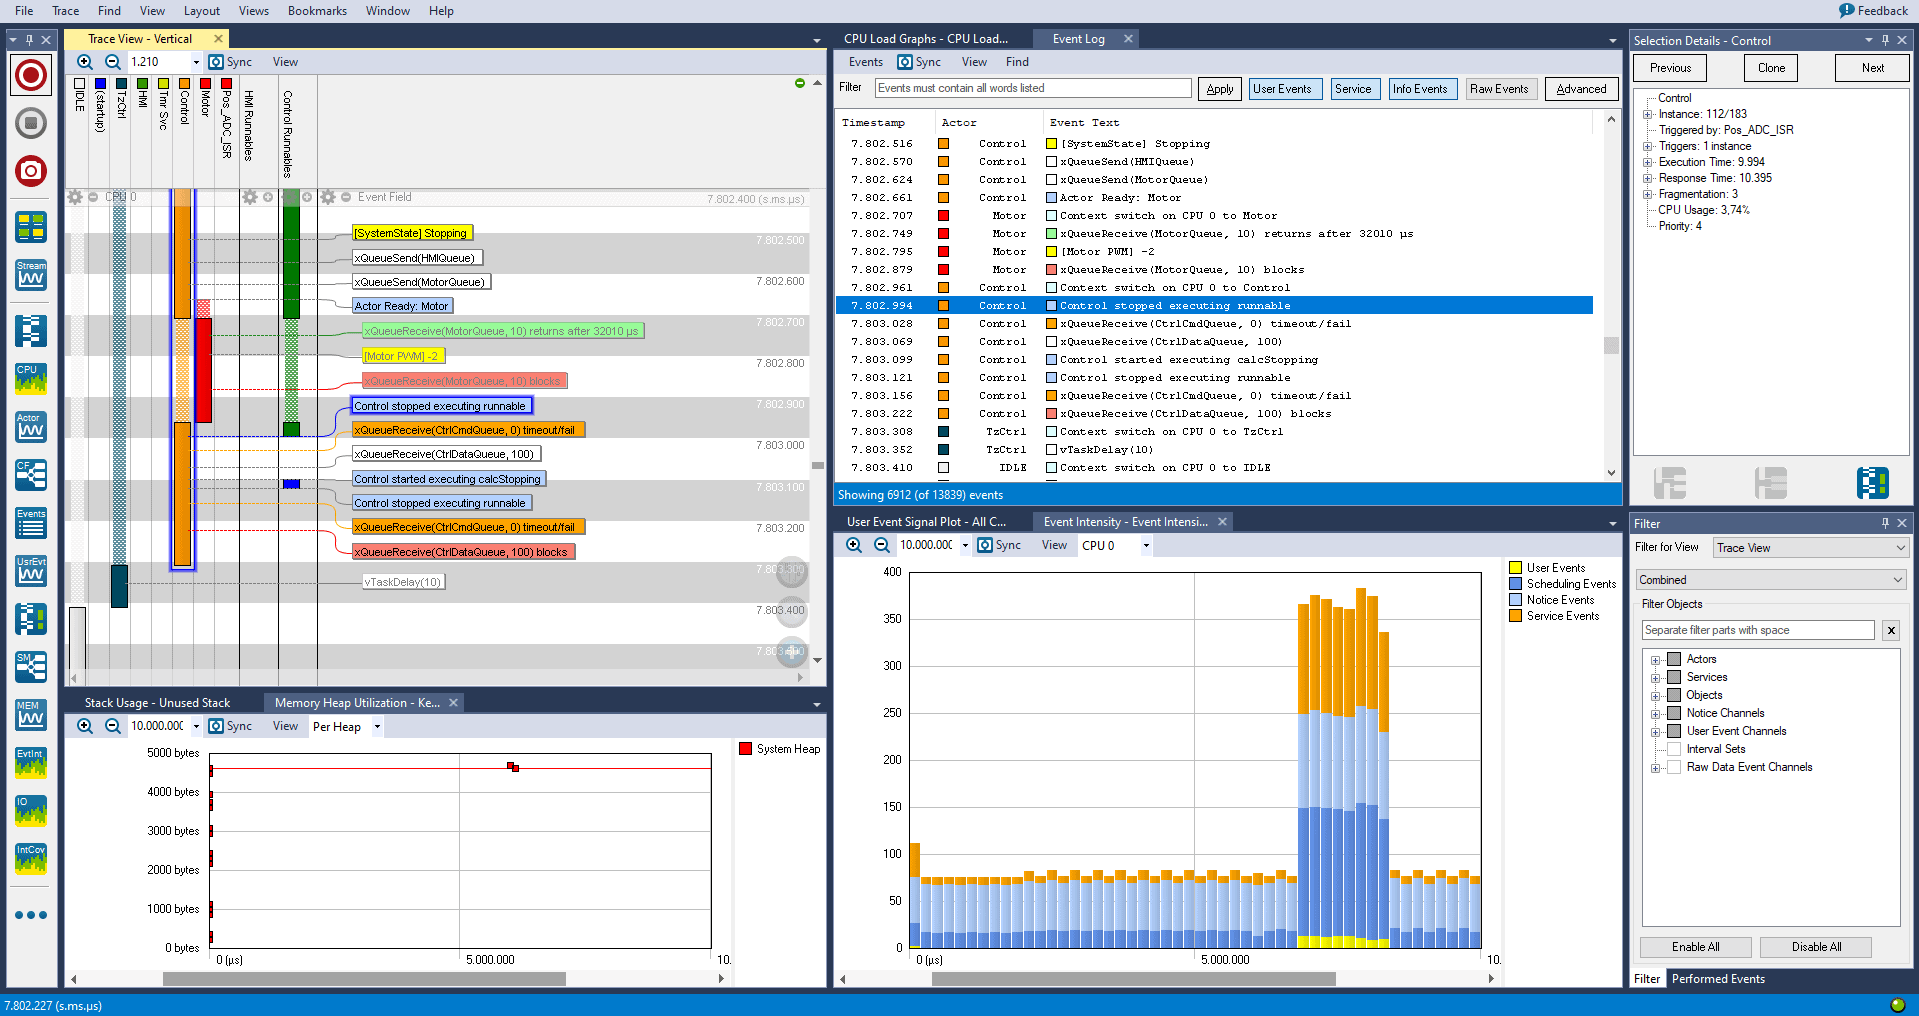
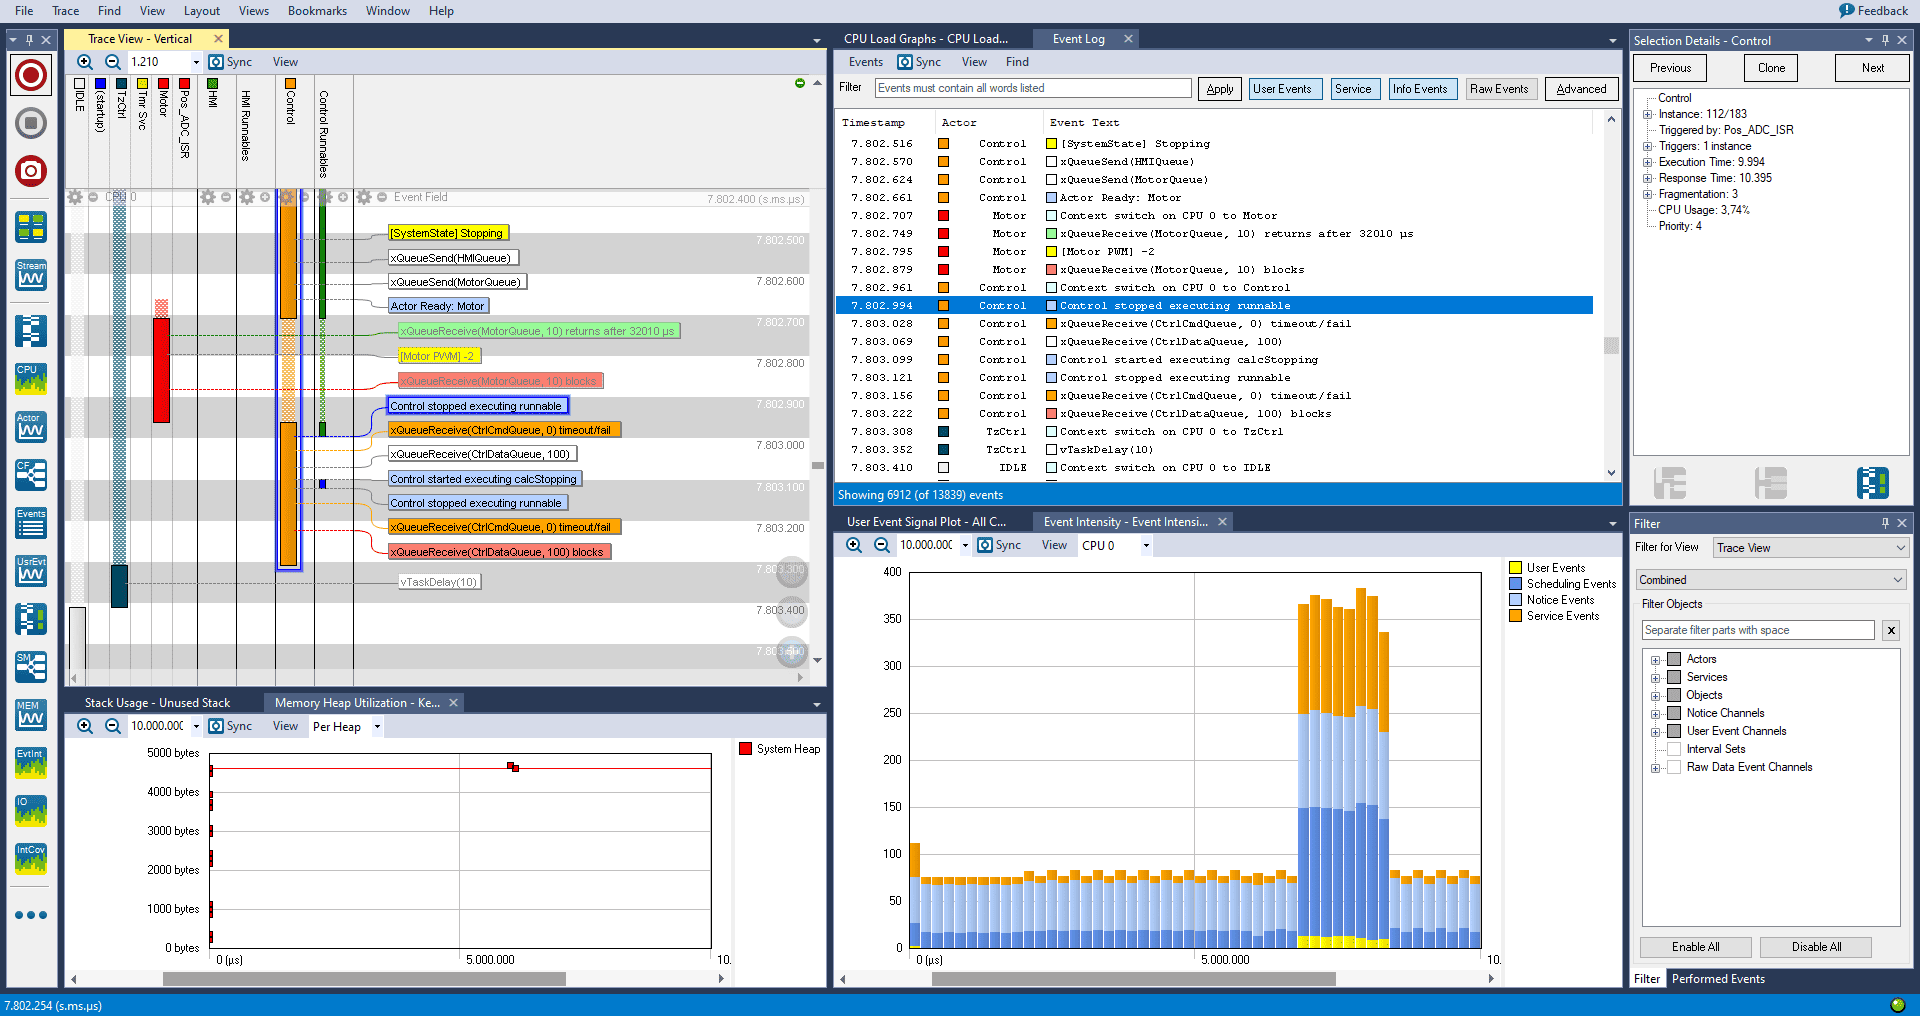
In the Trace View of Tracealyzer, all runnables of a task are by default shown in a single lane, with different colors for each runnable – see image at top. This can be expanded to one lane per runnable using the ⊕ button. In the default Gantt view preset, runnables are grouped separately from actors, while the Actors with Intervals preset (below) places each runnable lane next to the lane of its associated task.
When the execution of a runnable is suspended by a task switch, the rendering in the main trace view will change from a single box per interval to fragmented style (very similar to actor instances).
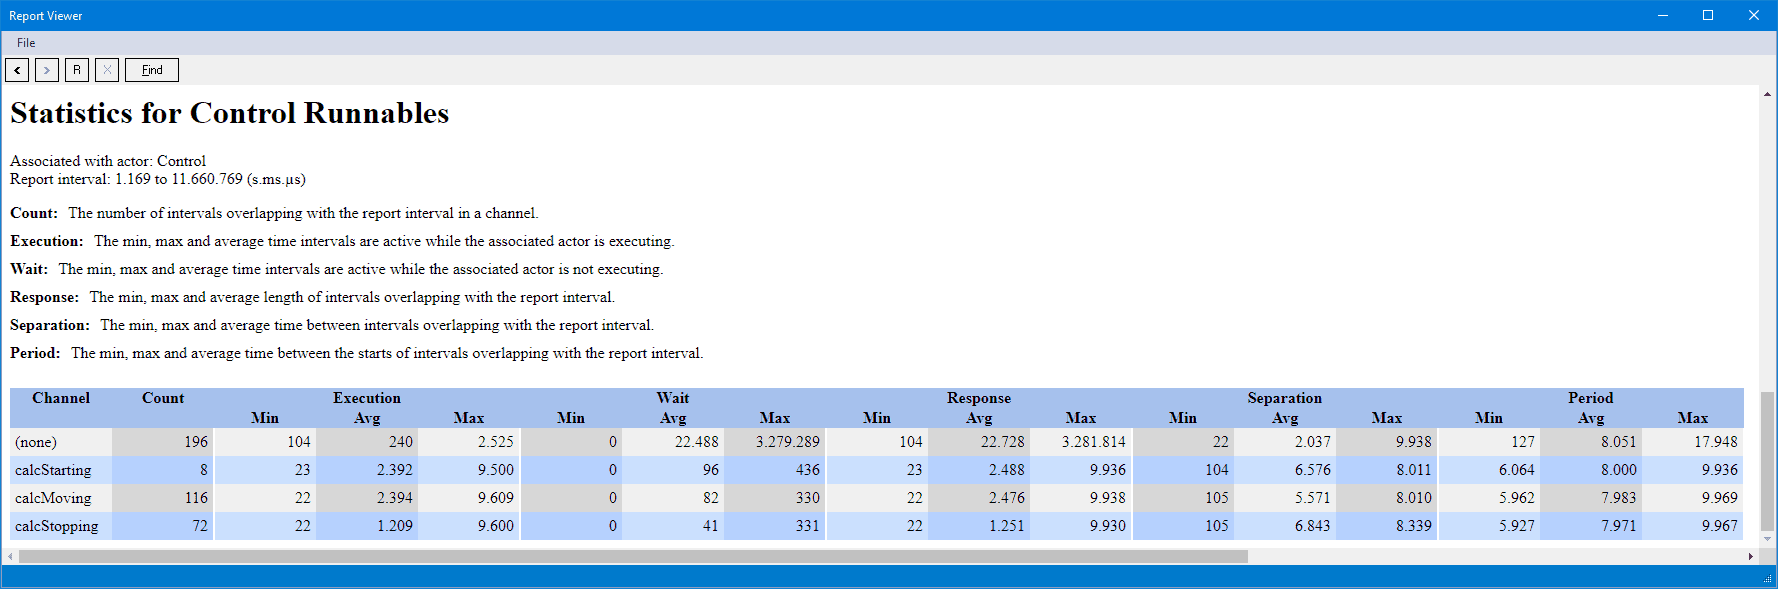
Statistical metrics of runnables can be accessed via the Actor and Intervals Statistics report.
Finally, please note that runnable tracing is not supported in the legacy snapshot-only mode (TRC_RECORDER_MODE_SNAPSHOT). We recommend all Tracealyzer users to use the newer streaming mode which supports both streaming and snapshots. This is the default setting in recent versions of TraceRecorder.