We collect examples of how Tracealyzer has been of useful to our customers and have recreated similar issues to illustrate the benefits of our Tracealyzer tools for embedded software developers.
In this case, a customer had an issue with a randomly occurring reset. By placing a breakpoint in the reset exception handler, they figured out that it was the watchdog timer that had expired. The watchdog timer was supposed to be reset in a high priority task that executed periodically.
The ability to insert custom User Events comes handy in this case. They are similar to a classic “printf()” call and events have here been added when the watchdog timer was reset and when it expired. User events also support data arguments, and this has been used to log the timer value (just before resetting it) to see the watchdog “margin”, i.e., remaining time. The result can be seen below, in the yellow text labels.
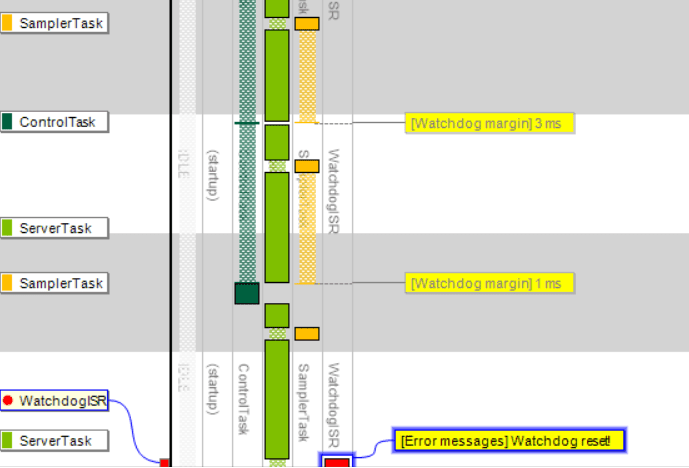
We can see that the SamplerTask is running, but it does not clear the watchdog timer in the last execution of the task, which resets the system after a while (“Watchdog reset!”). So why didn’t SamplerTask reset the watchdog timer? Let’s enable Kernel Service calls to see what the task was doing.
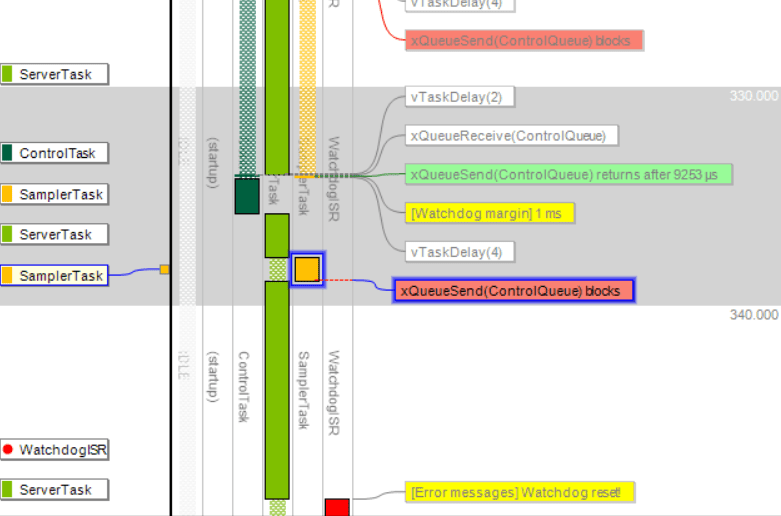
The last event of SamplerTask is a call to xQueueSend, a kernel function that puts a message in a message queue. Note that the label is red, meaning that the xQueueSend call blocked the task, which caused a context-switch to ServerTask before the watchdog timer had been reset, which caused it to expire and reset the system.
So why was xQueueSend blocking the task? By double-clicking on this event label, we open the Object History View, showing all operations on this particular queue, “ControlQueue”, as illustrated below.
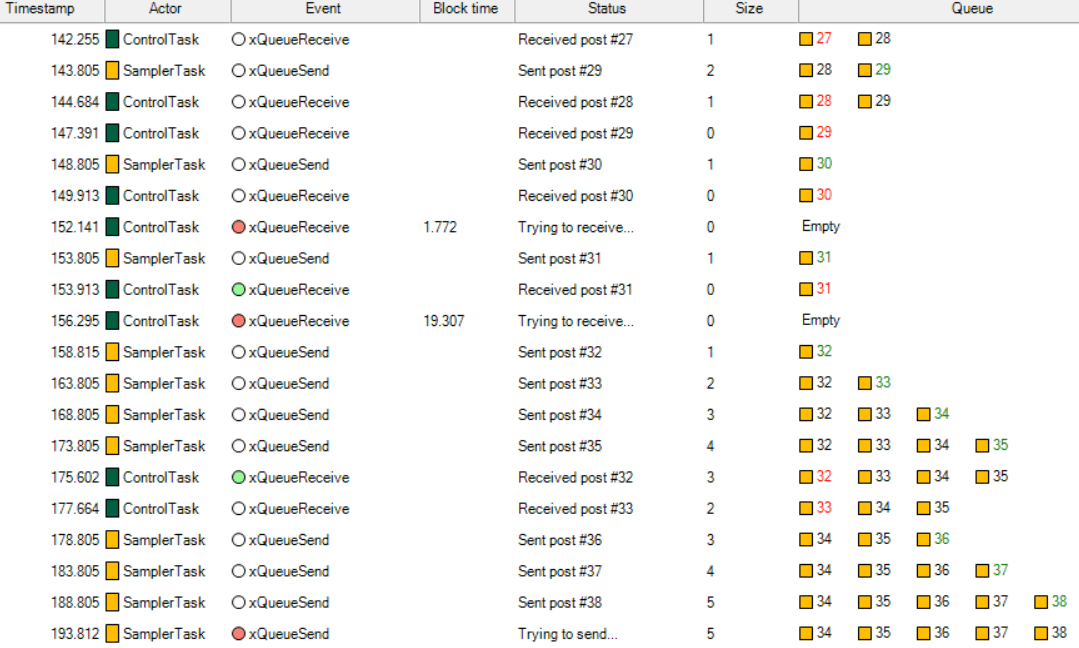
The rightmost column shows a visualization of the buffered messages. We can see that the message queue already contains five messages and probably is full, hence the blocking. But the ControlTask is supposed to read the queue and make room, why hasn’t this worked as expected?
To investigate this, it would be interesting to see how the watchdog margin varies over time. We have this information in the user event logging, and by using the User Event Signal Plot, we can plot the watchdog margin over time. And by adding a CPU Load Graph on the same timeline, we can see how the task execution affects the watchdog margin, as shown below.
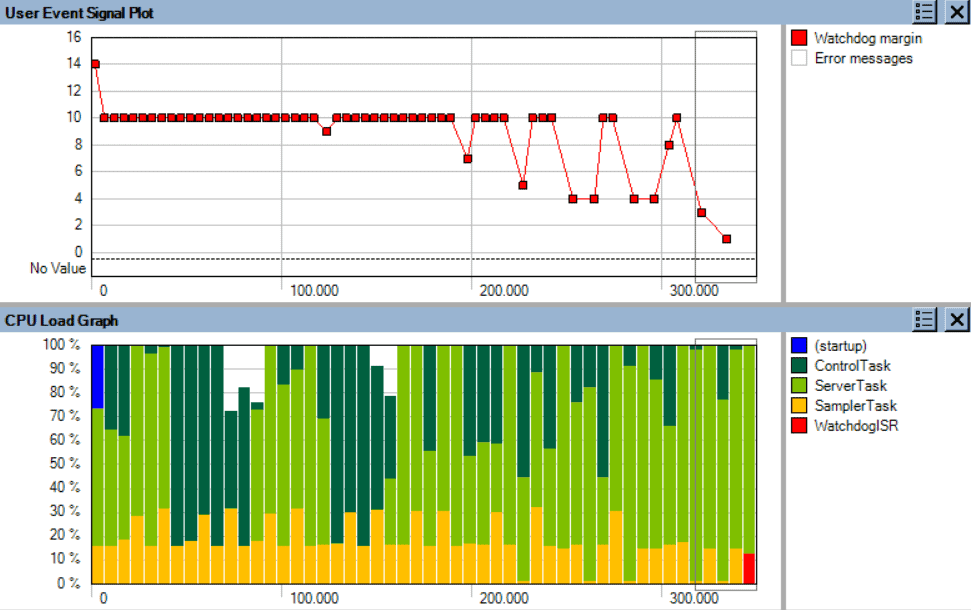
In the CPU Load Graph, we see that the ServerTask is executing a lot in the second half of the trace, and this seems to impact the watchdog margin. ServerTask (bright green) has higher priority than ControlTask (dark green), so when it is executing a lot in the end of the trace, we see that ControlTask is getting less CPU time. This is an inherit effect of Fixed Priority Scheduling, which is used by most RTOS. Most likely, this could cause the full message queue, since ControlTask might not be able to read messages fast enough when the higher priority ServerTask is using most of the CPU time. This is an example of a Priority Inversion problem, as the SamplerTask is blocked by an unrelated task of lower priority. A solution could be to change the scheduling priorities, so that ControlTask gets higher priority than ServerTask. Let’s try that and see how it would look.

The above screenshot shows the result of switching the task scheduling priorities between ServerTask and ControlTask. The system now shows a much more stable behavior. The CPU load of SamplerTask (here red) is quite steady around 20%, indicating a stable periodic behavior, and the watchdog margin is a perfect “line”, always at 10 ms. It does not expire anymore – problem solved!
Tracealyzer provides over 20 interactive views of the runtime world, connected in clever ways. It is available for several leading real-time operating systems as well as for Linux.