Do you struggle with bugs that are difficult to replicate and isolate? Most embedded software developers encounter such problems now and then. With increasingly complex multi-threaded RTOS-based systems, such issues are likely to become more and more common in the future. They can be very difficult and time consuming to solve, and sometimes developers resort to speculative fixes, that perhaps just moves the problem. Full understanding often requires the ability to observe the detailed software behavior over extended periods of time. This can be achieved with software tracing, but may result in huge traces that are difficult to analyze.
If you are familiar with Percepio Tracealyzer, you know it allows for recording a trace of your embedded software over long periods, by streaming the trace data to your host PC for visualization and analysis. In Tracealyzer v3.x there is however a practical limitation on how large trace files that could be analyzed, due to RAM usage and loading times. It works great on traces with several million events, as long as you have enough RAM in your PC. But the trace length is in practice limited to 20-60 minutes on typical computers.
This has now changed. The upcoming Tracealyzer v4.0 release (feb 2018) brings several major improvements, including “long trace support” – practical ability to analyze huge traces, spanning many hours, days or even weeks. The screenshot below shows an excerpt from a 10 hour trace displayed in Tracealyzer 4, that was loaded in a few minutes on a standard PC. In contrast, analyzing this 10-hour trace with Tracealyzer 3 would require hundreds of GB of RAM and several hours loading time.
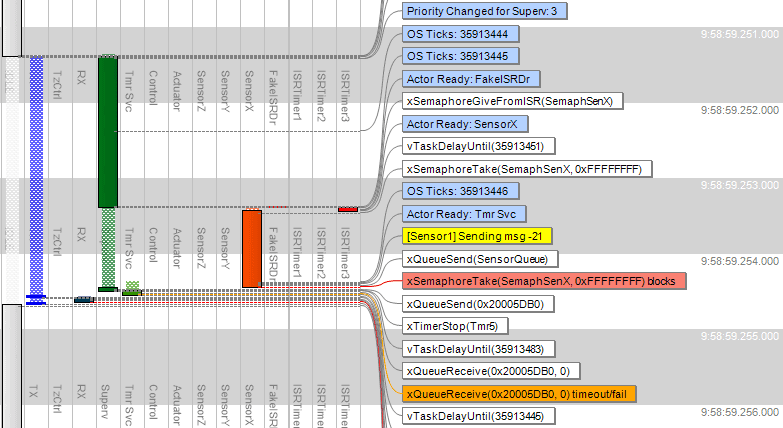
How is this is possible? The trick is to avoid loading the entire trace into memory. When opening a large trace file in Tracealyzer 4, you now get a preview window showing high-level metrics such as CPU load, where you may select a relevant section from the trace and only load that part, say a few seconds or minutes of data. You may still load the full trace if you prefer, but often you are only interested in a small subset of the trace. Although the preview metrics don’t tell you exactly where your bugs are located, they reveal significant changes in the software behavior that could be of interest. Just select an interesting section and hit the “Open” button for a closer look (e.g. using the trace view shown above).
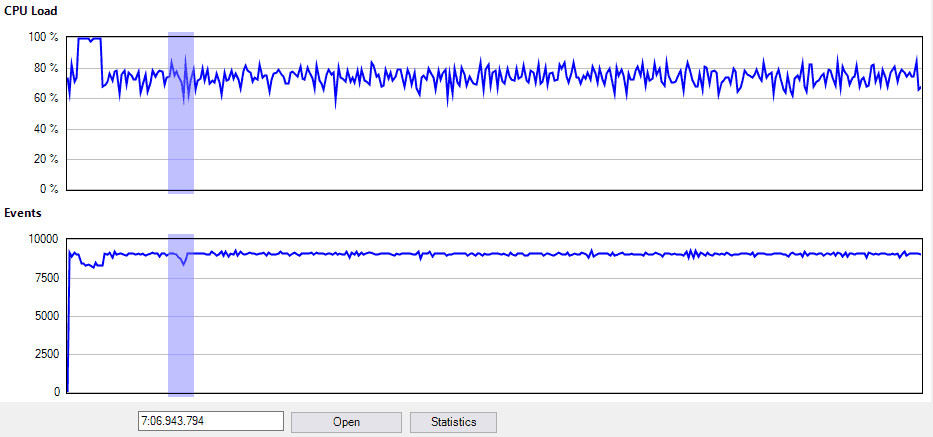
Generating this preview is much faster than doing a full load of the entire trace, and can be done in the background while recording. The memory usage of the preview generation is small and constant, independent on the trace length. If the preview data is already available, the preview window opens directly, otherwise it is quickly generated. In my experiments, it took 15 seconds to generate a preview of a 1-hour trace (17.9 million events), and this scales linearly with the trace length. In the initial v4.0 release, the preview window provides two graphs, shown above. The CPU Load graph shows the amount of processor time used by application tasks (all except the idle task), while the Events graph shows the rate of recorded events.
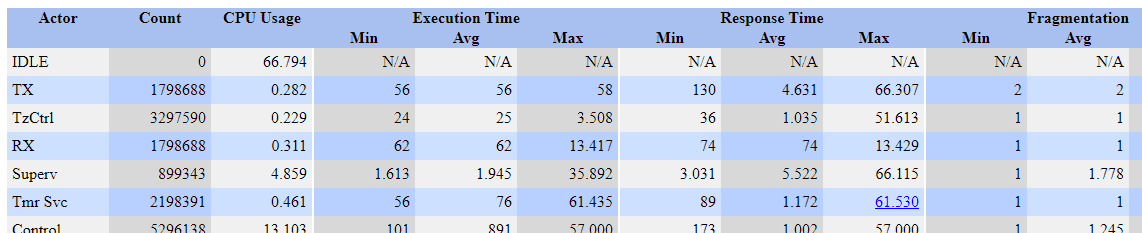
The “Statistics” button shows a report with descriptive statistics for the whole trace, such as highest execution time and response time for the individual tasks. Since this is part of the preview data, you may collect such performance metrics over practically unlimited durations. Moreover, you can click on any of the extreme values (highest, lowest) to highlight the corresponding location in the preview window and open this section for a closer look. This way, you can quickly locate points of interest in the trace already at the preview level, without loading the whole trace.
Another big improvement is that the actual loading is now performed in a single pass (i.e. in linear time). In contrast, Tracealyzer 3 used multiple analysis passes. This has made the actual loading much faster, important if you want to load a full trace (or a larger section). A speedup of 4-5x was observed in my experiments below.
Moreover, this has allowed for powerful live visualization, also included in Tracealyzer v4.0. See this video for an example (a bit outdated, it looks even better now).
Tracealyzer 4 vs. Tracealyzer 3
We have made some experiments in order to compare the loading time and RAM usage of Tracealyzer 4 vs. Tracealyzer 3, using the same traces. Each measurement was repeated multiple times to ensure stable results.
We started with a 1-hour trace, 265 MB of data containing 17.9 million events (“Trace 1”). This was however a bit too large for my computer to load in full. It could be loaded, but the RAM usage maxed out, which probably affected loading times. So to ensure a valid comparison we also compared with a smaller trace, “Trace 2”, containing 3.3 million events.
Trace 1 (17.9 million events)
| Version | Load time | RAM usage |
|---|---|---|
| v3.3 | 290 s | 5.6 GB |
| v4.0 | 52 s | 5.3 GB |
Trace 2 (3.3 million events)
| Version | Load time | RAM usage |
|---|---|---|
| v3.3 | 47 s | 1.2 GB |
| v4.0 | 12 s | 1.1 GB |
Quite nice speedups. Tracealyzer 4 was about 4x faster on Trace 2 and almost 6x faster on Trace 1!
The difference in speedup between Trace 1 and Trace 2 can be explained by the RAM usage. Since my 8 GB of RAM was almost fully allocated when loading Trace 1 in full, the 300 MB lower RAM usage of Tracealyzer 4 probably affected the amount of page swapping, that impacts performance a lot.
What about really huge traces?
So how long traces are possible? Disk space is no problem, since RTOS-level tracing only generates moderate amounts of data (typically a few hundred KB/s). You can store weeks of trace data on a modern hard-drive. Our example application generated 265 MB in a 1 hour session, so if starting a trace session on Friday afternoon at 5 pm and returning on Monday morning at 8 am (63 hours), the trace would require about 17 GB. With today’s storage capabilities, huge traces like that are no big deal.
A 10 times larger trace would be 630 hours – more than 26 days – and require about 170 GB. For such large traces, you should ensure that Tracealyzer generates the preview data in the background while recording the trace (this setting is enabled by default), otherwise the preview generation would take about 2-3 hours after the trace is completed.
Tracealyzer v4.0 will be released in Feb 2018, with support for FreeRTOS and Keil RTX5. Additional RTOS support will follow soon.
See also this post with three videos showing other new features.