Xilinx development kit ZC702 features a Zynq 7000 programmable SoC, lots of RAM and on-board I/O connectors ranging from HDMI to Gigabit Ethernet and USB. We set out to build a Tracealyzer demo application for this board, based on FreeRTOS and lwIP, with live trace streaming over Ethernet.
During this work we discovered an interesting issue in the lwIP port for Xilinx Zynq. It seems to be using FreeRTOS in a rather inefficient way, which was pretty obvious to see with Tracealyzer as described below. This could easily have been missed without the insight from a tool like Tracealyzer.
The finished demo project is provided in the end of this article. Here is what I did to set it up:
-
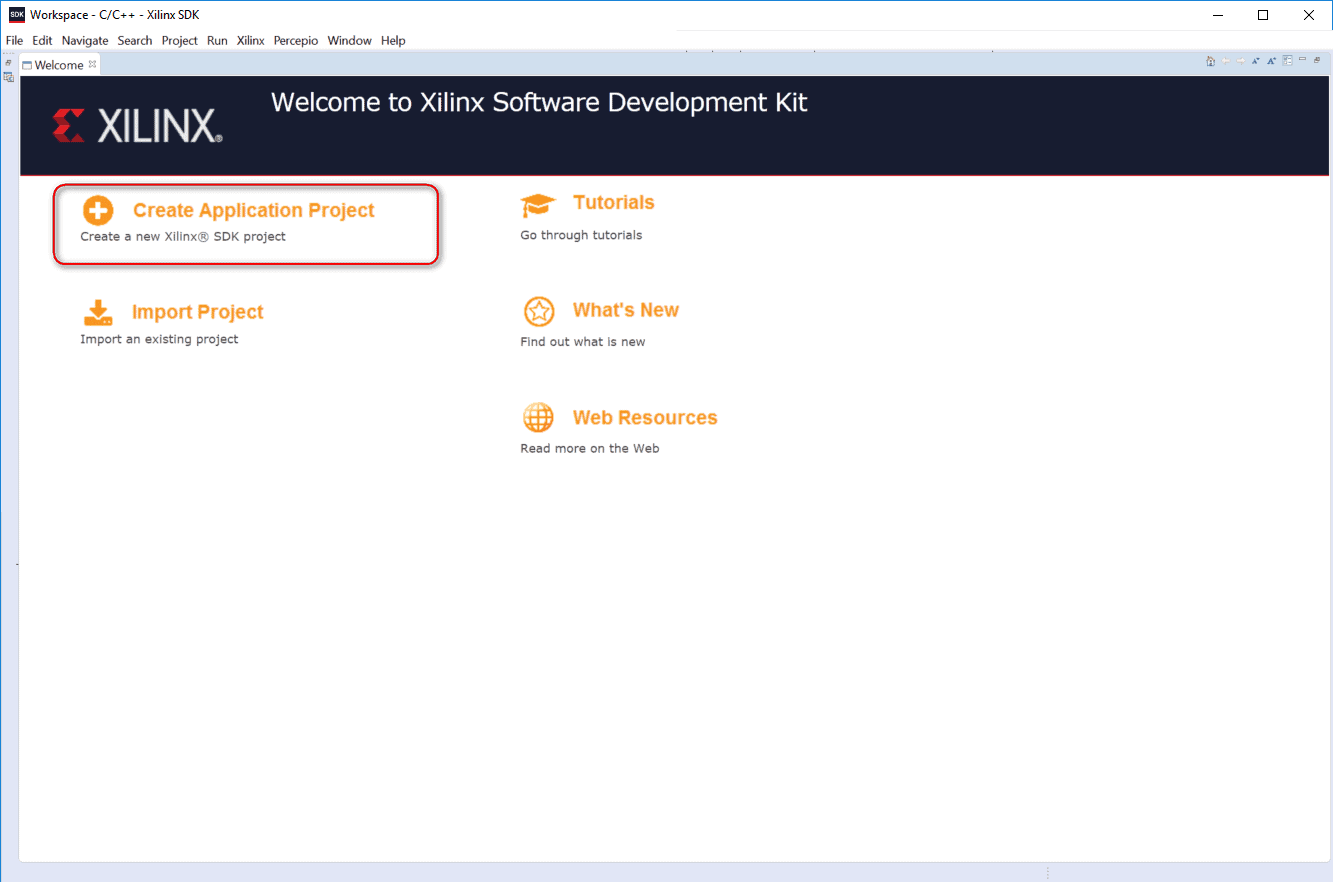
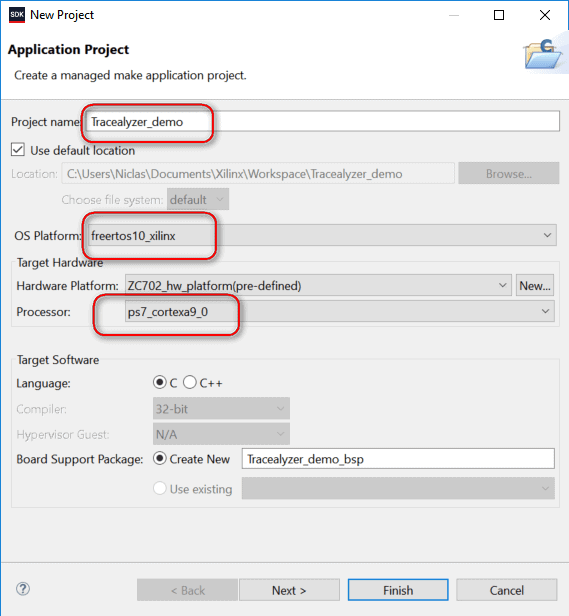
Create a project
As starting point I selected an application project with FreeRTOS and lwIP and named it Tracealyzer_demo. Also note that the CPU is a Cortex A9; we’ll need that information later.

-
Modify the project
The first issue I faced was that you could not modify the FreeRTOS setup to enable the tracing. The generated project contains a generated BSP folder with the source code for both lwIP and FreeRTOS, and also libraries built from this source code. These files are regenerated every time you rebuild the application, which is a major problem when you want to integrate the Tracealyzer recorder library as changes made to files such as FreeRTOSConfig.h are overwritten and lost on the next build.
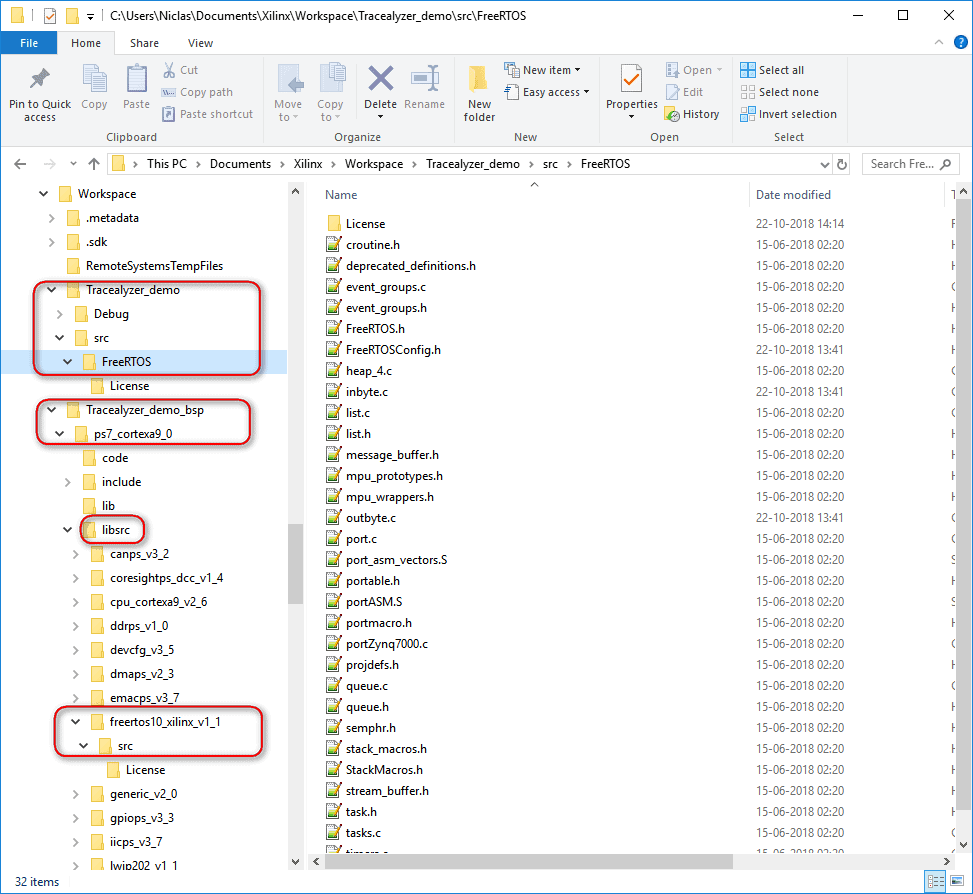
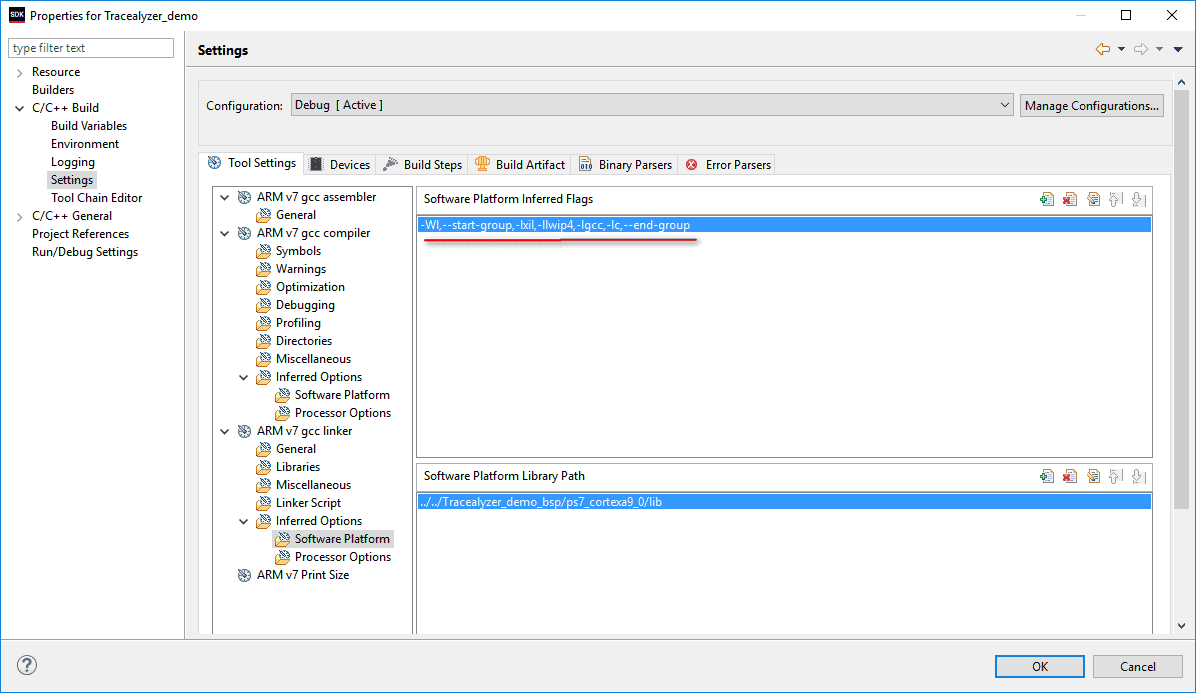
To work around this, I added a local copy of the generated FreeRTOS source files in the project, so we build the source code instead of using the generated library. I also had to remove the generated FreeRTOS library from the linker settings, leaving just the lwIP library there.
At this point, building the project works fine and produces the same result as the original, generated project.
-
Add the Tracealyzer recorder
I followed the instructions in the Tracealyzer User Manual, and made sure to use my local copy of FreeRTOS rather than the generated code in the BSP folder.
This is found in Help -> User Manual -> … -> Integrating the Recorder (the exact path depends on which version of Tracealyzer you’re using).
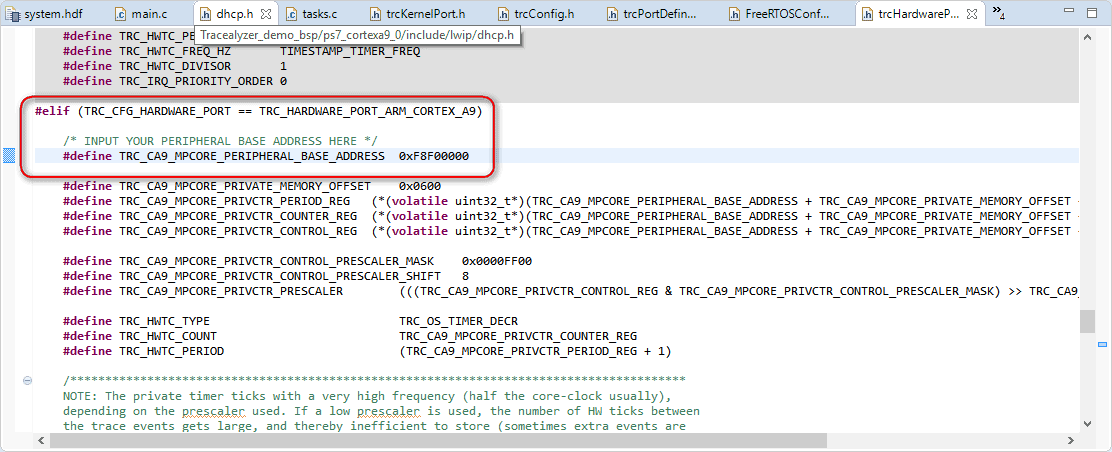
In trcConfig.h, there’s an #error statement that should be replaced with a processor-specific header file, if one is needed. None is needed in this case, so I just commented out the statement. Since the processor core is an Arm Cortex-A9 and the trace recorder has support for this already, we simply set TRC_CFG_HARDWARE_PORT to TRC_HARDWARE_PORT_ARM_CORTEX_A9. In this case, we also need to modify TRC_CA9_MPCORE_PERIPHERAL_BASE_ADDRESS in trcHardwarePort.h; the value varies from one Cortex-A9 device to another, but for this project the correct setting is 0xF8F00000.
-
First run – Snapshot mode
The default setup is snapshot mode, where the trace data is kept in a circular RAM buffer. I let the application run for a few seconds, to make sure that it has had time to acquire an IP address, before halting it and taking a snapshot of the trace buffer. The easiest way to take the snapshot is through the debug terminal and the command is
mrd -bin -file <path/trace.bin> <StartAddress> <Size>For this example, StartAddress was set to 0x214000 and Size to 0x3000 as the linker placed the buffer just above address 0x214000. Note that the specified address range must not match the trace data exactly. As long as the entire trace buffer is within the specified address range, Tracealyzer will find the trace data automatically.
As we mentioned earlier, this board has a lot of RAM which meant I could try a little experiment. I set TRC_CFG_EVENT_BUFFER_SIZE in trcSnapshotRecorder.h to a value slightly larger than default – a hundred times larger, actually. Obviously, I had to adjust the parameters to the mrd command accordingly. I decided to test with 100 000 events and the application built just fine; in fact, there was still memory to spare. Did I mention that this board has quite a lot of RAM?
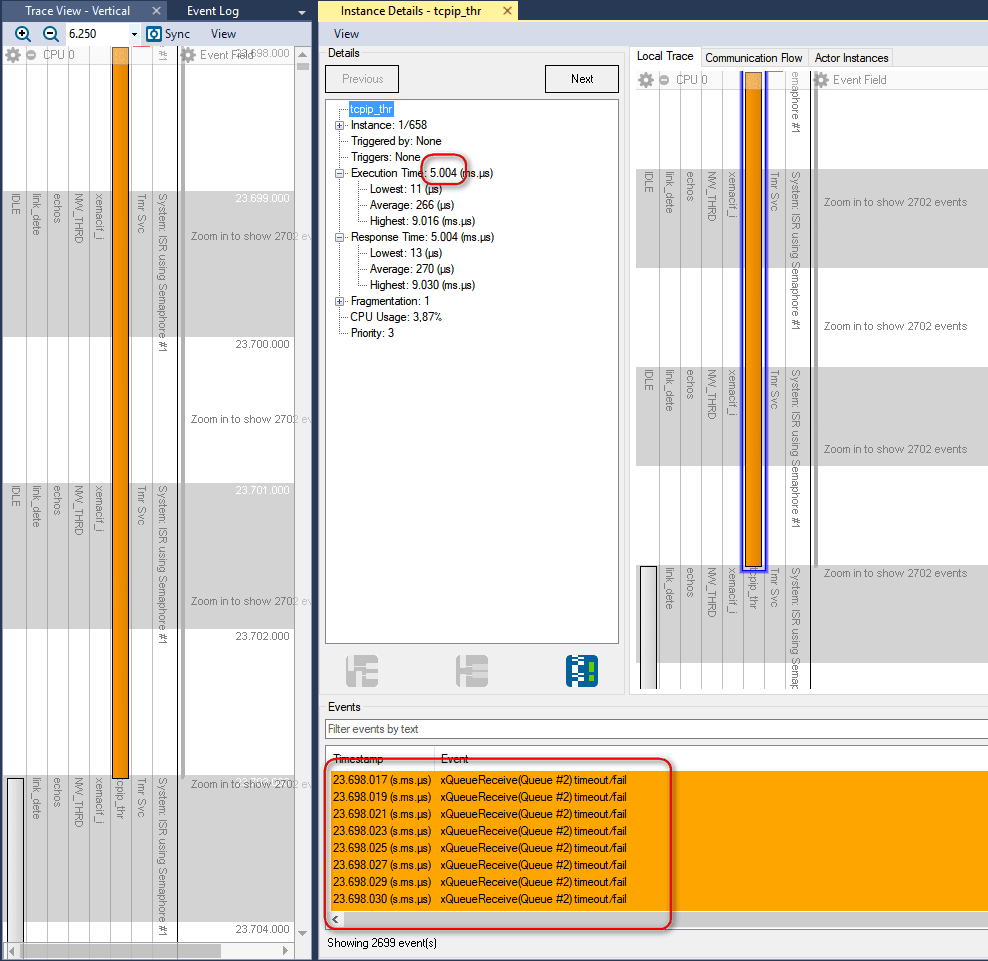
When I brought up the large event trace I just had recorded in Tracealyzer, I noticed something peculiar. A task called tcpip_thr sometimes runs for 5 ms, but it seems that most of the time it is just waiting for data from a queue. Or not exactly waiting but rather actively polling the queue as fast as possible. This was easy to see in the Event Intensity view, where these locations had massive spikes. We can see that event timestamps are only separated by about 2 µs, and this includes the recorder overhead. This is really an odd idea in a system based on an RTOS, where you can block the task until data becomes available on the queue. Moreover, this polling generates a large amount of trace data – about 200.000 events per second. This would be problematic to stream over TCP/IP, as the buffers could overflow and cause data loss.
When examining the source code, it seems clear that the person who created this lwIP port did indeed use “0” as the timeout value when attempting to “wait” for a message, which means that the xQueueReceive function returns directly if there is no data.
As I didn’t want to change the code too much, I decided to simply filter out all TCP/IP tasks and events from the trace. This is done with the help of two Recorder API functions, vTraceSetFilterMask() and vTraceSetFilterGroup(). I make sure that all tasks and objects I want to include in the trace are assigned filter group 0 (the default group) while the TCP stuff is assigned to group 15, and then set the filter mask to only trace group 0. It should be said that events filtered out in this manner aren’t simply discarded, they are never even registered by the recorder library.
-
Streaming trace
Now, with the excessive TCP/IP-related events filtered out, we can now stream trace data to the host computer over TCP/IP. This way we can see the trace live in Tracealyzer and record much longer traces.

To switch to streaming mode, we change the recorder mode setting TRC_RECORDER_MODE_STREAMING in trcConfig.h and include the TCP/IP stream port in our build. This is done by including the code from TraceRecorder/streamports/TCPIP. This stream port is actually written for lwIP so it works without modifications in this case, but you can easily modify it for other TCP/IP stacks. Make sure that trcStreamingPort.c is is included in your build, and that trcStreamingPort.h is found by the compiler. Finally, make sure you are calling vTraceEnable(TRC_INIT); in your startup, rebuild and run the system.
In Tracealyzer, open “Settings” -> “PSF Streaming Settings” and select Target Connection: TCP. Enter the IP address of your target system and the port number used by the trace recorder. This is by default 12000 and is defined in trcStreamingPort.c. Now you can click “Start Recording” in Tracealyzer, which sends a command to the target system to begin tracing. The resulting trace is displayed live in Tracealyzer.
Note that only some of the views in Tracealyzer can be displayed live, so once you have recorded enough trace, make sure to select “Stop Recording” to enable all 30+ views.
You find the finished demo project here: ZC702-EK_XilinxSDK2018_TCPIP.rar (4.7 MB). Feel free to try it out, and contact us at support@percepio.com if you have any questions.