Mohammed Billoo, founder of MAB Labs, provides custom embedded Linux solutions for a multitude of hardware platforms. In a series of posts over the coming weeks, he will walk us through the new Linux support in Tracealyzer v4.4, using a real-world project as an example.
 In a previous blog post, we saw how Tracealyzer for Linux, developed by Percepio, can be a valuable utility to ensure that our Linux driver is performant. While the previous post provided a high-level overview of the relevant views in Tracealyzer that we can use for our analysis, this blog post will dive into a key component of a Linux device driver, which is the IRQ handler, and how Tracealyzer can give us feedback on the performance of our handler.
Essentially, we want to perform the fewest operations possible in an IRQ handler, because the kernel (and the entire processor) is in a sensitive state. For example, all interrupts are masked (i.e. no other interrupt can fire) and the Linux scheduler is effectively paused for the duration of the IRQ handler. Thus, we need to ensure that we are doing only the bare minimum to address the interrupt, such as register operations and moving data around in the processor memory, and defer managing the data transfer operation itself to other kernel mechanisms (such as a tasklet). In our specific example, we know from the device specification that an interrupt will fire every 80 milliseconds, and so that will be the upper bound on how long the IRQ handler can take to execute.
Tracealyzer eliminates the need for print statements
We can use Tracealyzer to ensure that our IRQ handler is doing as little as possible. The advantage of using Tracealyzer is that it eliminates the need for any extraneous printks (which, as we’ll see, can actually hide incorrect implementations) and comparison of timestamps in kernel logs. Tracealyzer for Linux also eliminates the need to pore over LTTng traces to evaluate performance. It provides a clear view of our IRQ handler.
Going back to the example of developing a Linux device driver for our data acquisition device, recall that a GPIO from the device will be the impetus to the driver that data is ready to be collected.
Our simple IRQ handler is shown below along with the relevant code to “register” it with the kernel:
static int __init mab_init(void)
{
  result = request_irq(irq_number, (irq_handler_t) mab_irq_handler,
  IRQF_TRIGGER_RISING, "mab_irq_handler", NULL);
  return result;
}

static irq_handler_t mab_irq_handler(unsigned int irq,
void *device, struct pt_regs *regs)
{
  printk(KERN_INFO "MAB - got interrupt!\n");
  return (irq_handler_t) IRQ_HANDLED;
}
We’re simply printing to the kernel log that we received an interrupt and letting the kernel know, by way of the return value IRQ_HANDLED, that the interrupt was handled.
Before we load our kernel module and connect our device, we have to start LTTng on the target device a bit differently from what’s described in the “Getting Started With Tracealyzer for Linux” guide. We’ll need to run the following commands to tell LTTng to only capture IRQ handlers (we’re also going to ignore scheduler events so that we can focus solely on the interrupt handler):
$> lttng create
$> lttng enable-event -k irq_*
$> lttng start
After transferring the LTTng traces to our host machine and firing up Tracealyzer, this is what we see, when we open the “Trace View”, the “Selection Details” (on the right), and the “Actor Instances” graph (Note: only the IRQ handler is selected in the Actor Instance graph to allow us to focus our attention):
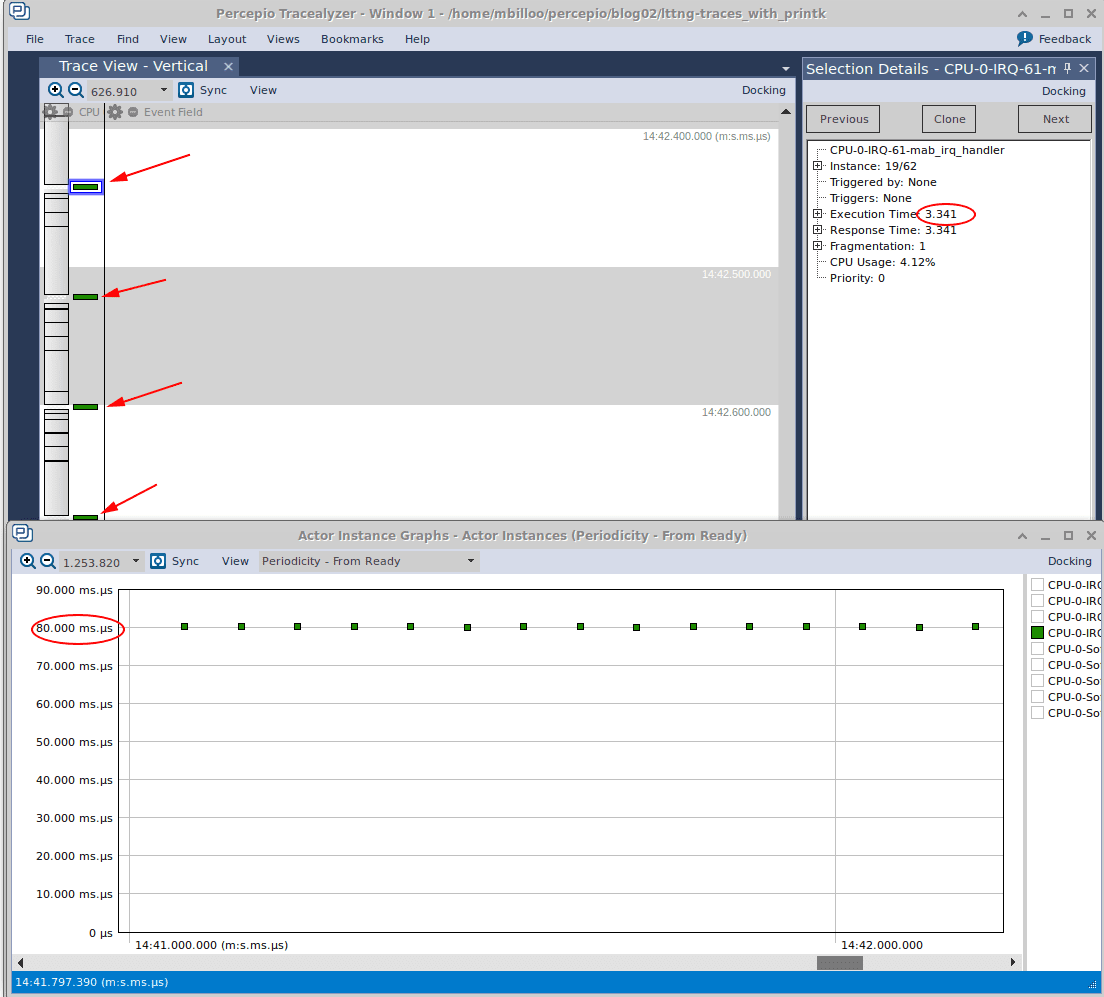
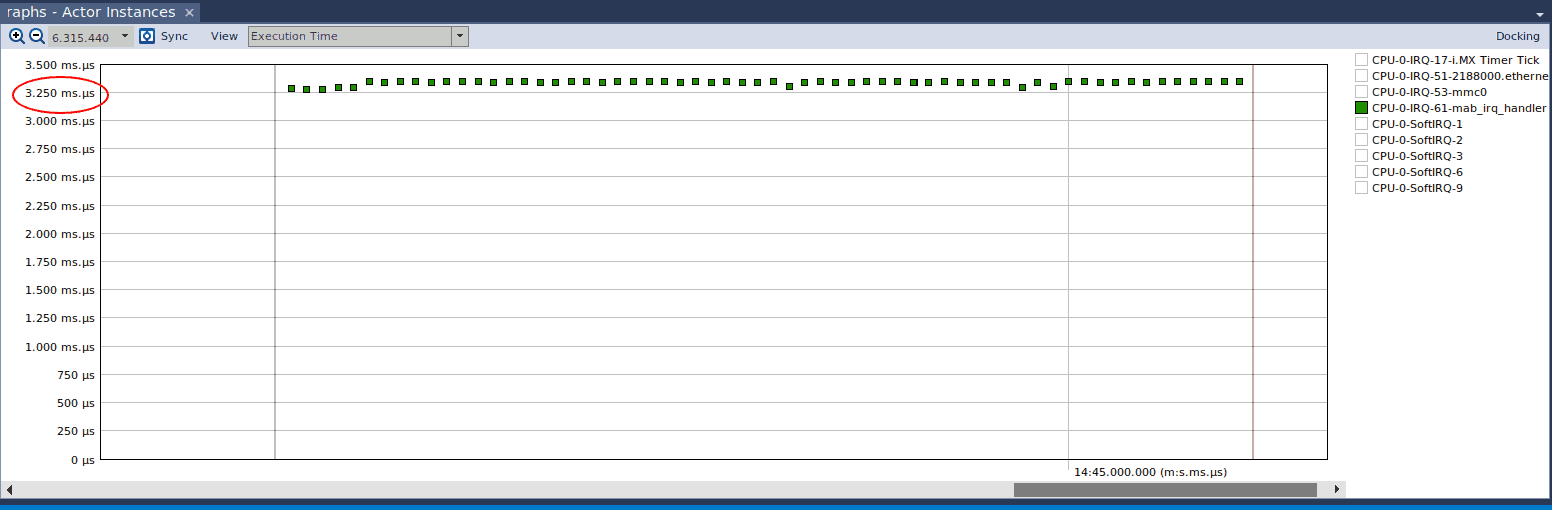
In the above image, we’ve adjusted the “View” dropdown box in Actor Instance Graph to select ‘Periodicity – From Ready’. It shows us how often the IRQ handler is firing. We can see that it’s roughly every 80 milliseconds, which is in line with our expectation. The “Selection Details” window shows us that one instance of the IRQ handler took approximately 3.3 milliseconds to execute. If we change the View dropdown box of the Actor Instance graph to “Execution Time”, we see that on average, the execution time is about 3.3 milliseconds.
Now, let’s remove the printk call and see what Tracealyzer shows us. If we focus on the Actor Instance graph, with the View set to Execution Time, this is what we see:
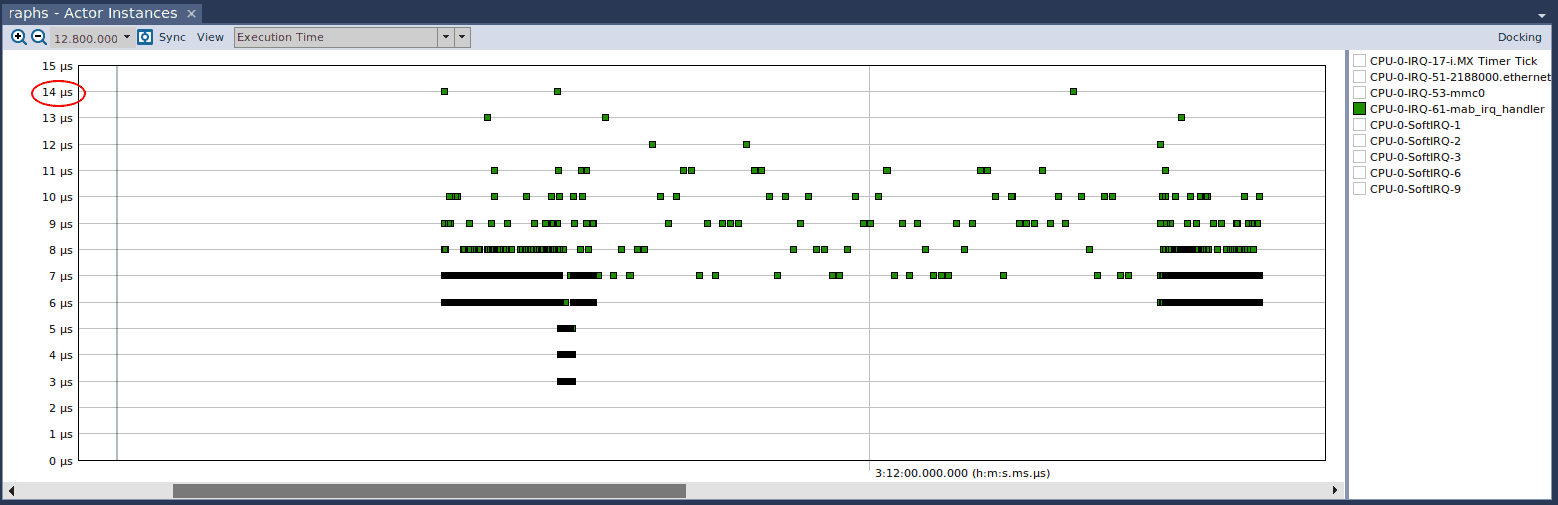
The maximum execution time is now 14 microseconds, compared to the average execution time of 3.3 milliseconds with printk. This demonstrates the substantial overhead of a call to printk, which is expected since it must handle a myriad of different cases to support printing to the kernel log. Nonetheless, we should be careful in using printk, or any of its derivatives, liberally in an IRQ handler, since we don’t want to hinder performance.
Another interesting observation we can make from the above figure is that execution time is pretty erratic. While the differences are in the microseconds, it’s useful to understand why there is such a large disparity. To determine what may be causing it, let’s shift back to “Periodicity – From Ready”, and this is what we observe:
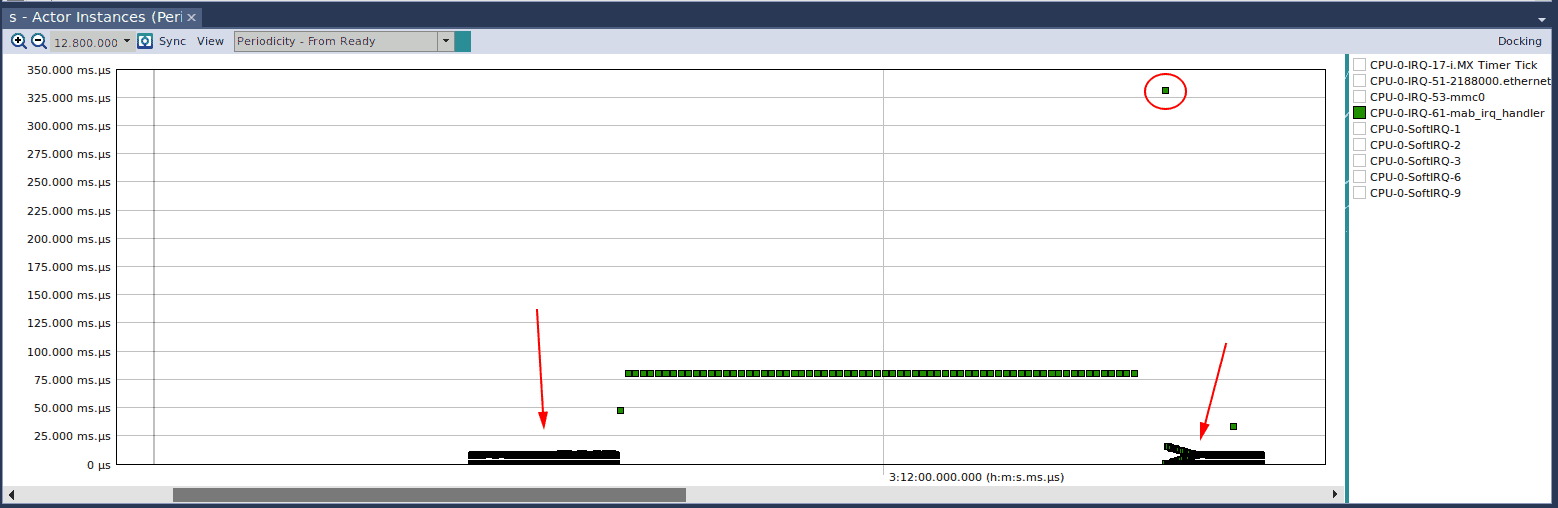
We can clearly see that something is really wrong. While during the middle portion of the capture, the IRQ handler is being called every 80 milliseconds, as expected, there are moments during the beginning and end of the capture that it is being called much more often. We can also see that near the end of the capture, there is one instance of the execution that happened after 325 milliseconds!
This is because we never instructed the device in the IRQ handler to stop firing the interrupt. Since the interrupt is always present, the Linux scheduler keeps giving execution resources back to the IRQ handler; this adverse phenomenon is commonly known as “thrashing”.1
Printing masked out the bug
Another important observation we’ve made using Tracealyzer is that the printk had actually masked this bug. Since the time between the invocation of the IRQ handlers with the printk was approximately 80 milliseconds, we would have completely missed the fact that we needed to instruct the device to stop firing interrupts until we had handled the first interrupt. Instead, this bug would have manifested itself as we approached release and removed extraneous printk calls. At that point, major modifications to the driver would incur significant time and cost.
In summary, using Tracealyzer during different stages of driver development could expose bugs as well as performance issues. We see here that it can be a tremendously valuable tool in ensuring that a critical component of any device driver – the IRQ handler – is performant. We also see the advantages of using Tracealyzer for this purpose instead of using printks, which could add substantial overhead.
Mohammed Billoo, MAB Labs
1 UPDATE: Since we’re not instructing the device to stop firing the interrupt, why do we see the periodicity of the IRQ handler level out ultimately (we would expect the CPU to continue to thrash). After looking into the device specification, it became clear that it has a fail-safe mechanism which automatically de-asserts the interrupt if it has not been acknowledged over the I2C bus. When including the printk in the IRQ handler, the execution time of the IRQ handler extends into the deassertion time, which effectively masks the fact that our own code does not properly de-assert the interrupt over the I2C bus.
This is the second in our series of articles about using Tracealyzer to capture and analyze visual trace diagnostics for embedded Linux systems.