Mohammed Billoo, founder of MAB Labs, provides custom embedded Linux solutions for a multitude of hardware platforms. In a series of posts over the coming weeks, he will walk us through the new Linux support in Tracealyzer v4.4, using a real-world project as an example.
 When developing an application that’s targeting a Linux-based system, it is important to configure our system to maximize performance, because misconfiguration can limit application performance. For example, I was part of a team that developed an application to receive and process data from a software-defined radio (SDR). Data was being output by the SDR at a very high rate and it was important to minimize packet loss. Unfortunately, we saw substantial packet loss during initial bring up of the Linux system, and needed to determine the cause. We hypothesized that the so-called CPU affinity of the application was not set appropriately.
While I didn’t have access to Tracealyzer for Linux at the time (this was in 2017) and the hypothesis was shown to be incorrect, let’s revisit the problem to see how Tracealyzer can help determine why the hypothesis was incorrect, and capture the results in this particular blog post. Since I no longer have access to the original system, application, and the SDR, I made do with a replacement.
We’ll use a Jetson Nano as our Linux system replacement, “iperf” as our userspace application, and another Linux system as a replacement for the SDR. Iperf is a utility that is commonly used to test the performance of a network link between two Linux systems. This diagram shows the basic setup of the experiment.
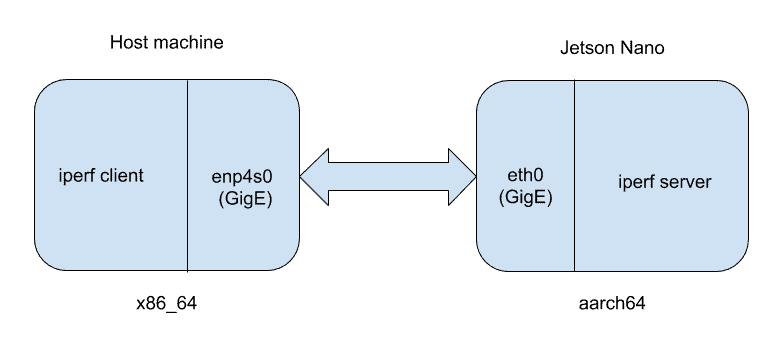
On the right is the Jetson Nano (64-bit ARM architecture) running iperf in server mode. On the left is the host machine (x86_64 architecture) running iperf in client mode. We are going to adjust the CPU affinity of the iperf server on the Jetson Nano to observe how that parameter affects the overall throughput performance between the client and server.
The term CPU affinity signifies the particular CPU core that an execution context is pinned to. Usually, this is set on an application basis. My hypothesis is that if the CPU affinity of the interrupt and corresponding handler matches the CPU affinity of the process receiving packets, then packet loss should be minimized, because time isn’t wasted moving data between cores.
First, we will determine the affinity of the eth0 interface on the Jetson Nano. This will tell us which processor core handles interrupts from the eth0 interface. To do this, we execute the following command on the Jetson Nano:
$> cat /proc/interrupts/ | grep eth0
407:    1881331          0          0          0  Tegra PCIe MSI   0 Edge      eth0
We can see that the first core (CPU0) handles these interrupts. Next, we run iperf in server mode on the Jetson Nano:
$> iperf -s -B 192.168.2.247 -p 5001
Still on the Jetson Nano, we execute these commands to determine the default CPU affinity:
$> ps ax | grep iperf
12910 pts/0    Sl+    1:25 iperf -s -B 192.168.2.247 -p 5001
$> taskset -p --cpu-list 12910
pid 20977's current affinity list: 0-3
The first command retrieves the process ID (PID) of the iperf command. We use the PID in the taskset command, together with the flag –cpu-list, to determine which processor cores are allowed to run iperf. Initially, we see that any processor core can run iperf.
Then we run iperf in client mode from our host machine, by executing the following command where we are attempting to push through 1 Gbps of data to the server (and we can see we’re getting pretty close to that limit):
$> iperf -b1G -c 192.168.2.247 -p5001
[  3]  0.0-10.0 sec  1.10 GBytes   851 Mbits/sec
Consider what would happen if we didn’t allow Linux to choose the optimal processor core, and we instead pinned the iperf server execution to a specific core? Let’s artificially handicap our setup to evaluate the impact on throughput. We do this by pinning the iperf server to CPU3 (recall that CPU0 is responsible for handling interrupts from the eth0 interface) with the following command on the Jetson Nano:
$> taskset -p --cpu-list 3 12910
pid 20977's current affinity list: 0-3
pid 20977's new affinity list: 3
Running iperf again, we get the same average throughput of 851 Mbps. Since I hypothesized that it would take more time to send data from CPU0 to CPU3, throughput should have dropped but it didn’t. Tracealyzer can help us find out why.
First, we start a lttng capture on the Jetson Nano:
$> lttng create
$> lttng enable-event -k -a
$> lttng enable-event -u --all
$> lttng add-context -k -t pid
$> lttng add-context -k -t ppid
$> lttng start
Then we run an iperf test from the host machine, and then stop lttng and destroy the session to avoid having large traces with extraneous events.
$> lttng stop
$> lttng destroy
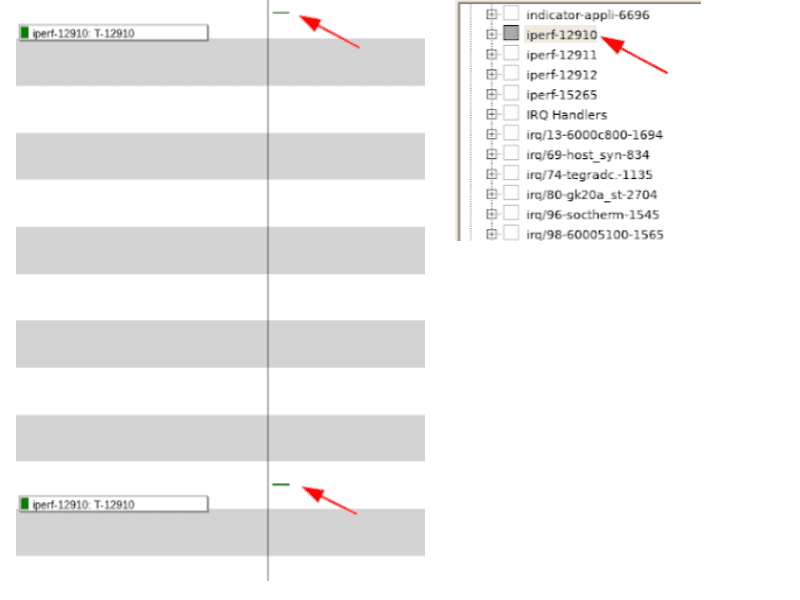
We can see a few interesting results in the capture when iperf is pinned to CPU3. First, notice that there are four instances of the iperf process running, even though Linux listed only a single instance. Next, notice that the instance of iperf that corresponds to the PID reported by Linux executes only twice: once at the beginning of the iperf measurement and once at the end.
We can also see that even though we instructed iperf to be pinned to CPU3, there are other instances of iperf executing on different CPU cores.

Although we instructed iperf to limit its execution to CPU3, something caused it to run on other CPUs. This is actually not that uncommon, since applications can implement their own logic for selecting the appropriate CPU for execution. It appears that iperf has similar logic implemented as well.
When we zoom out on the trace, we see a flurry of execution instances of the eth0 interrupt handler executing at around the same time as the iperf experiment, and we can conclude that there is a correlation between when the eth0 interrupt handler is executing and when the iperf instance is executing.
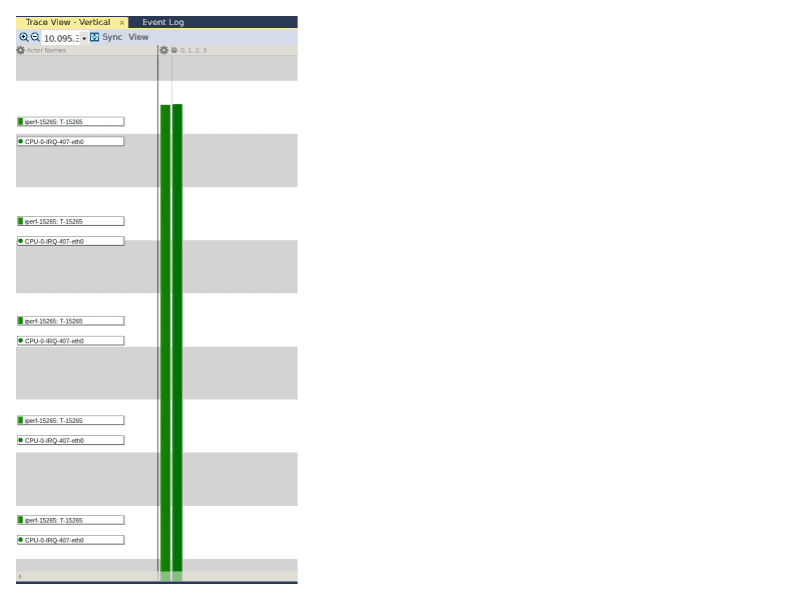
If we zoom in to the middle of the trace above to focus our attention on the throughput measurement itself (to avoid the distraction of any protocol-specific exchange between the perf server and client), a pattern appears.
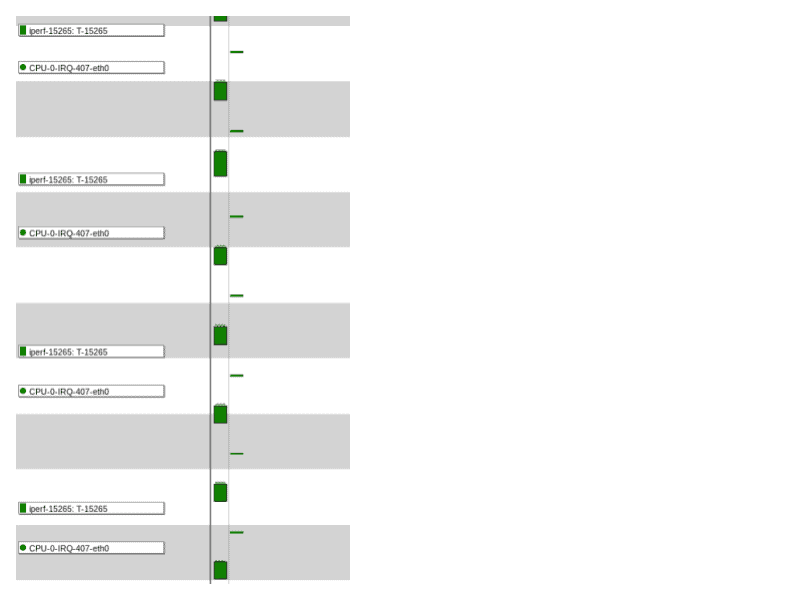
If we zoom into the trace even further and measure the time between when the eth0 IRQ handler has completed execution and the start of the iperf execution, we can see that it is approximately 55 microseconds.
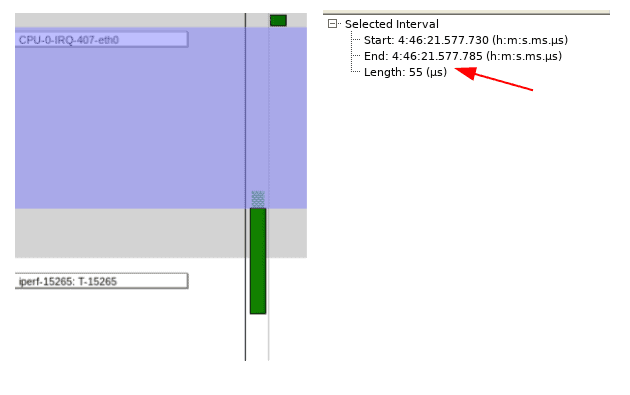
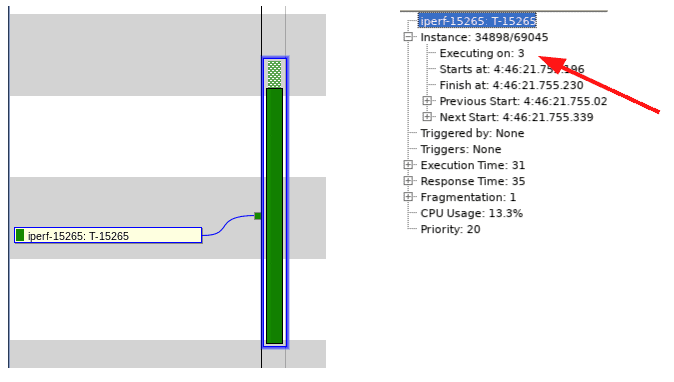
When we click on that particular iperf execution instance and then click on the “+” next to the “Instance” in the Selection Details view, we see that this particular instance of iperf is executing on CPU3 as expected!
As a baseline, we now know it takes 55 microseconds from completion of the eth0 interrupt handler to when the iperf instance begins execution. Now, let’s put the system under load, by executing the following command on the terminal of the Jetson Nano, which runs 20 processes across all the CPUs:
$> stress --cpu 20
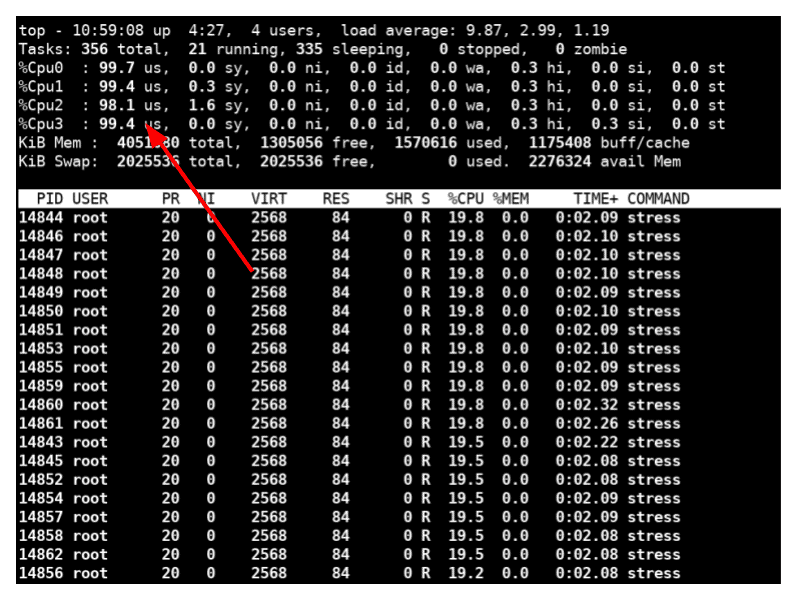
The output of the top command shows that all four cores are being throttled to their maximum.
When we perform a new iperf measurement, we see that the throughput is still 851 Mbps!
$> iperf -b1G -c 192.168.2.247 -p5001
[  3]  0.0-10.0 sec  1.10 GBytes   851 Mbits/sec
Let’s open Tracealyzer with a capture taken when we artificially stressed the CPU cores, zoom into the middle of the capture to look at the execution sequence of the eth0 interrupt handler and the iperf instance. Notice that the time between completion of the eth0 interrupt handler execution and the start of the iperf execution is now approximately 40 microseconds.
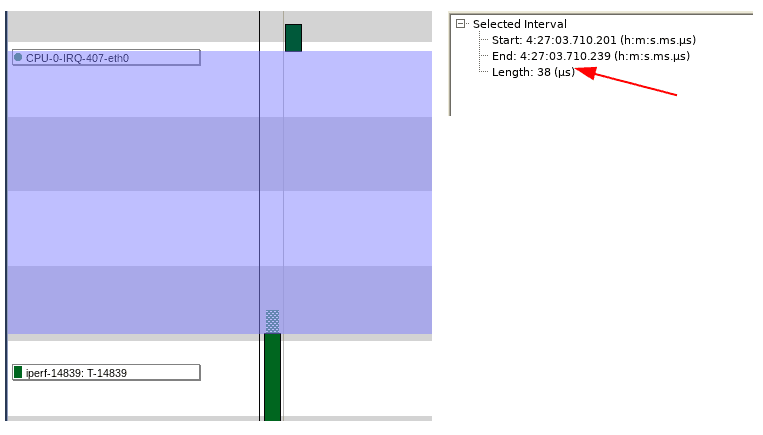
While the number itself isn’t important (although it is interesting that the time is less under load!), it is the same order of magnitude when the system is under load versus when it is not – 40 microseconds versus 55. This is a tremendous feature of the Linux kernel, where even with a userspace application seemingly hogging all four cores of the system, it is still ensures that other userspace applications are not starved for CPU resources and that inter-core communication is not affected.
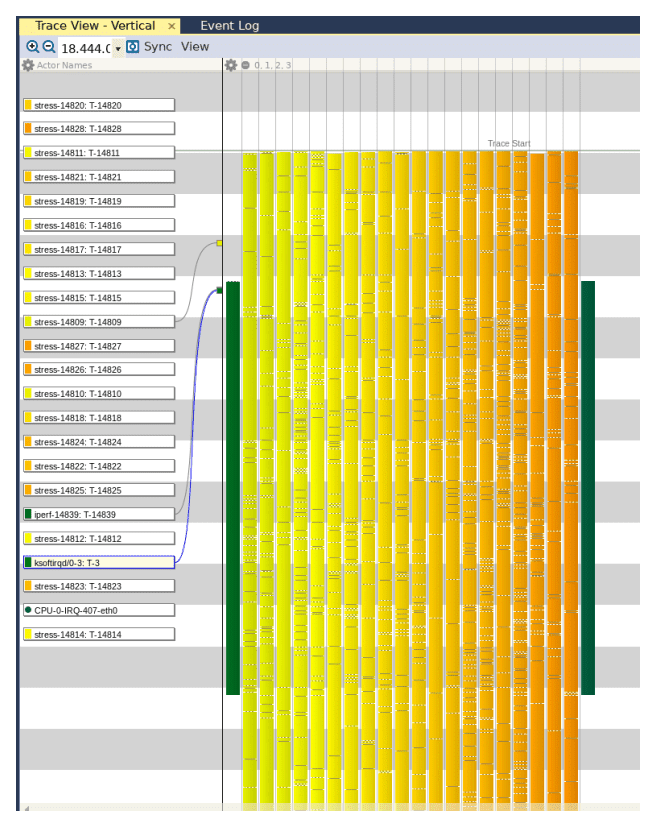
If we take a step back, we can see all the processes that represent the “stress” application, confirming that the CPU is indeed under heavy load.
To summarize, in this project I used Tracealyzer for Linux to test out a hypothesis about how setting the CPU affinity of a process would impact its performance. By analyzing the interactions between the different execution elements under normal and strenuous conditions, we identified a neat feature of the Linux kernel wherein a best effort is made to provide all processes with a fair share of CPU resources. Additionally, we drilled down to find out why the original hypothesis (that setting the CPU affinity of a process to process packets would reduce packet loss) was incorrect. Finally, while the analysis was by no means exhaustive, we have identified additional areas of focus, such as the Linux kernel scheduler and the iperf codebase, for further investigation.
Mohammed Billoo, MAB Labs
This is the third in our series of articles about using Tracealyzer to capture and analyze visual trace diagnostics for embedded Linux systems.