Increasing Complexity and Connectivity ⟹ Higher Risks
Software complexity grows exponentially, developer efficiency grows far slower. And debugging often takes up 20-50% of development time. More complex, connected systems means increased data flow at the edge, and in the cloud. That leads to increased exposure to vulnerabilities, cyber threats, malfunctions, and bugs with risks that are hard to assess.
Siloed views for development, integration, testing, deployment, and field maintenance leads to massive value being locked away due to lack of comprehensive observability.
Development never stops.
That is why we never stop talking about continuous observability.

Three questions we suggest you should ask yourself:
- Who should be the first to detect an issue, threat or anomaly in your cloud-connected edge device? You, or your customer?
- Once an issue is detected, how critical is the response time—identification, rectification, update deployment?
- How much risk—financial, reputational, lost time, lost productivity—are you willing to take?
Percepio’s Continuous Observability solutions will not necessarily answer those questions for you, but they provide the tools and information you need to implement your selected strategy.


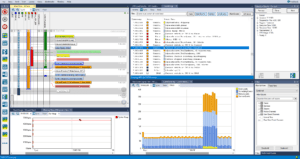 ➀ Percepio Tracealyzer®
World-class observability tool for embedded software
- Combines flight recorder, microscope and holistic system viewer for complex runtime systems.
- Records and visualizes key events in embedded software with more than 30 views.
- Offers extensive support for a dozen of the most common RTOSes, including Zephyr.
- Includes the Tracealyzer SDK for easy extensibility and customization.
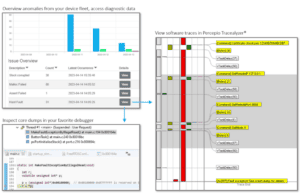
➁ Percepio DevAlert®
Cloud-based observability of edge devices
- Observe anomalies in edge devices and embedded software during testing and in deployed devices.
- Debug issues remotely and securely without having to expose a physical debug port.
- Maintain full control over diagnostic data.
- Inspect the call stack, function arguments, variables, registers, logs, sensor readings and more.
- Automatic collection of system trace data and core dumps for immediate insight.
- Source-code debugging in your local tools, one click from dashboard to debugger.
- Traces show the circumstances of the anomaly.
- Can be tailored to your unique needs through modularity, extendibility and customization.
➂ Coming Soon: Percepio Detect
For CI, system testing, and field testing
- Bridges the gap between Tracealyzer and DevAlert
- Includes new anomaly detection technology.
- For on-premises deployment, private networks.
- Planned release later in 2024!