 About 15 years ago, I worked at a company building network security appliances (with ARM-based network processors) and was responsible for the development of custom Linux firmware. The product launch was successful; we shipped and managed a large fleet of devices in the field. After a few firmware releases, we received alerts from the device management system telling us that there were intermittent problems. Remoted into the appliances but could not reproduce the error. Thankfully, after days of debugging, we eventually found the problem and fixed it with a firmware update …
Does this sound familiar? Let me share some more thoughts with you.
A few years later, I joined Microsoft building cloud and hybrid apps (such as IoT solutions) with our Azure customers. I continued to learn about similar challenges and the business requirements from customers:
- Need a tool to observe what’s happening in the application so we can easily troubleshoot and handle novel problems.
- For complex/distributed systems in the cloud, on-prem, or embedded systems at the edge, we need visibility into the applications to understand system health in order to identify problems that are nondeterministic or too complicated to reproduce locally.
Whether your apps are running in the cloud or on embedded devices, having tools ready to observe, monitor, trace and alert are absolutely crucial to your product development.
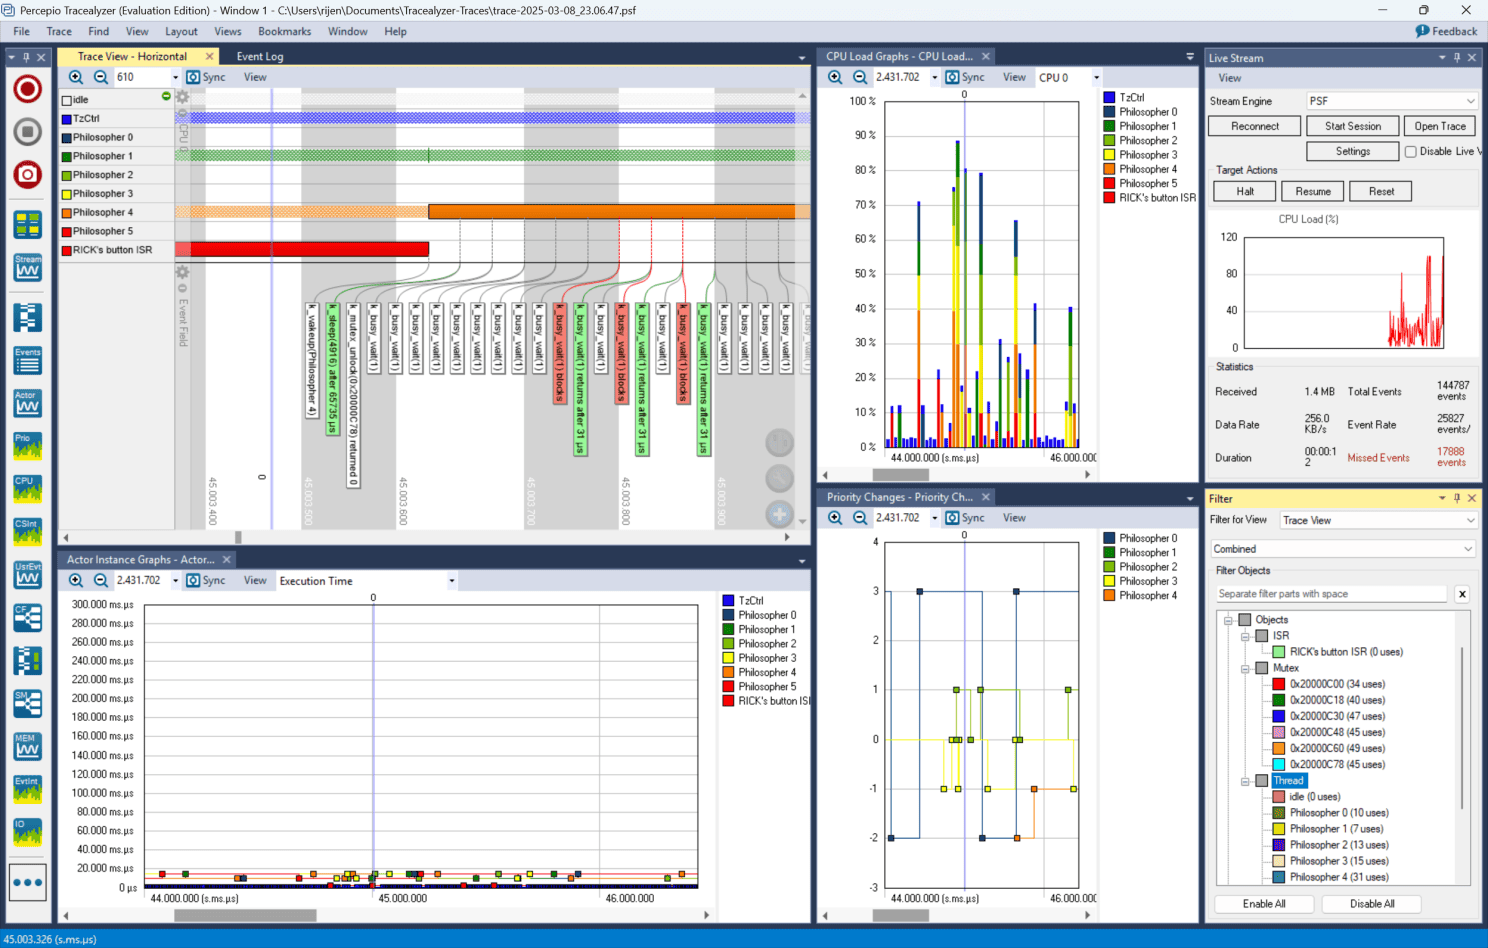
That is especially true for real-time embedded applications running on an RTOS such as Zephyr, FreeRTOS, Linux, ThreadX, etc. For my Zephyr and Linux IoT apps running on microcontroller-based boards, I had been using Percepio’s Tracealyzer like an X-ray to examine kernel scheduling events, interrupt service routines, and inter-thread communication over mutexes/semaphores.

I took this Tracealyzer screenshot during development to view the interaction of threads, their priorities and system load.
I find it very useful to keep historical records of traces while making progress in development. I was able to quickly identify bugs or performance bottlenecks simply by comparing a current trace with traces I had captured earlier.
Having an integrated tool that weaves software observability into every stage of your development lifecycle is a top priority. By providing real-time insights during development, early detection of issues in testing, and delivering actionable alerts in production, this unified approach enables your team to build RTOS apps that are reliable, efficient, and resilient in the field.
If you haven’t had such process integrated yet, I encourage you to look for a great continuous observability tool and integrate it into your workflow today!
Rick Jen, Microsoft Azure Principal Tech Specialist
