When developing embedded software, a good understanding of the real-time behavior is vital. At Percepio we develop the Tracealyzer tools for RTOS trace visualization, but this post is about a related technology from ARM that we believe is of general interest to any developer using ARM-based MCUs.
Having some form of diagnostic logging/tracing is necessary in most firmware development. But if using plain “printf” calls over a traditional serial port, the overhead is often many milliseconds per logging call, which disturbs the application behavior and is unacceptable in time critical code such as exception handlers or fast control loops. There might however be an excellent solution built in to your MCU already, at least if using an MCU with an ARM Cortex-M3, M4 or M7 core, namely ITM – Instrumentation Trace Macrocell.
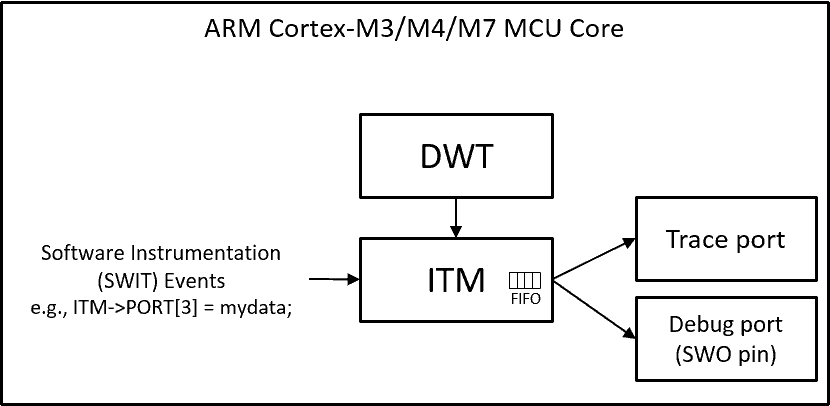
ITM is a hardware unit that can transfer diagnostic data of two main types:
- Debug events generated by the DWT unit, such as exception events and data watchpoint events.
- Software instrumentation (SWIT) events, i.e., custom data logged by your code.
Using ITM you can transmit any kind of data to the host PC as SWIT events, simply by writing the data to a memory-mapped register on your ARM-based MCU. This can be very fast with a proper debug probe, just a few clock cycles, and ITM even supports automatic time-stamping done by the hardware. Many IDE’s allows you to view this data in a debug window or to write the data to a file for later analysis. The data can be character-by-character text data (e.g, from printf) but it is also possible to send binary data as ITM supports up to 32 bits of data per write.
The ITM unit provides 32 logical channels for SWIT events, each with a corresponding stimulus register where it accepts input. These channels allow for separating the diagnostic data into different categories. For instance, ARM recommends channel 0 for text data (e.g., from printf) and channel 31 for RTOS events, while the other channels can be used for whatever purpose you like. The ITM channels share a common FIFO buffer in the ITM unit, that in turn is connected to one or two output ports. The ITM data is included with the instruction trace (ETM) if using the full trace port together with an advanced trace debugger, but it is also available via the commonly available Serial Wire Out (SWO) interface in the debug port. The SWO interface is supported by most debug probes targeting ARM MCUs.
The ITM FIFO buffer is pretty small, only 10 bytes, so if using a slow debug probe some data might be lost if writing too frequently to the ITM ports. This can be prevented by checking if the ITM FIFO has room for additional data before writing it and delay the write in case there is no room (see the below code example for “fputc”). This way may however cause a significant impact on the timing of your system, if your debug probe is too slow in receiving the data.
A better way to avoid data loss and blocking is to use a fast debug probe. Leading debug probes including SEGGER J-Link, the high-end Keil ULINK models and IAR I-Jet allow SWO sampling rates of 60-100 MHz and cost around €300-€600, money well spent according to me! With a probe like this, you can typically use the ITM ports with no risk of blocking or data loss.
Recently we did an ITM experiment with a Keil ULINKpro. Our test application managed to write over 2 MByte/s over ITM, many times more than required for typical Tracealyzer RTOS tracing. This data rate required us to “hammer” the ITM port in a tight loop on a fairly fast ARM Cortex-M4 MCU at 168 MHz and with optimized code. Our host-side test application verified the received data continuously and the data transfer was 100% reliable even at maximum speed. In this case there was some ITM blocking but not much – the average write time (including the blocking) was only 20 clock cycles (119 ns @ 168 MHz) and the longest blocking being around 100 cycles. However, at slightly lower data rates, there was no ITM blocking at all. In that case, the ITM writes took just 7 clock cycles, every single time! Very nice!
Using ITM in your code
The ITM stimulus registers are standardized by ARM and found on address 0xE0000000 (port 0) through 0xE000007C (port 31). To write data, all you need to do is to enable ITM tracing in your IDE (see below) and write your data to the corresponding register.
Assuming your board support package includes ARM’s CMSIS API (which it probably does), writing the data is simply:
#include "myMCU.h" // Includes CMSIS
…
ITM->PORT[0].u32 = mydata;
If you for some reason don’t have the CMSIS API in your system, you can simply define macros for the ITM stimulus registers like this:
#define ITM_PORT(n)   (*((volatile unsigned long *)(0xE0000000+4*n)))
…
ITM_PORT(0) = mydata;
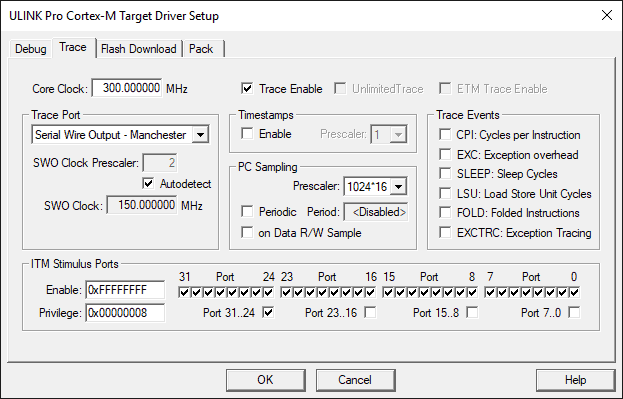
Before you can use ITM tracing, you need to enable the ITM tracing. Below is an example from Keil µVision, where the system has been configured to enable ITM tracing on all 32 ITM stimulus ports. In the “Trace Port” part, make sure to select Manchester mode if possible, which allows for much higher SWO clock frequencies than the UART/NRZ mode.
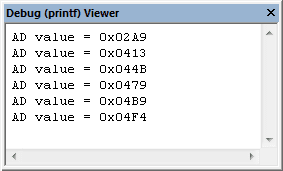
If using Keil µVision, you can see ITM data in two ways. Text output on ITM channel 0 is displayed in the “Debug (printf) Viewer”, found under View – Serial Windows.
To get your “printf” calls to write to ITM port 0, you need to define your “fputc” function like this:
struct __FILE { int handle; /* Add whatever needed */ };
FILE __stdout;
FILE __stdin;

int fputc(int ch, FILE *f)
{
    if (DEMCR & TRCENA)            // Only if ITM is available
    {
        while (ITM_PORT(0) == 0);  // Block until room in ITM FIFO
        ITM_PORT(0) = ch;          // Write the data
    }
    return(ch);
}
The Trace Records window in Keil µVision displays a table with all traced events, including all 32 ITM channels. This allows you to study also binary data logged on other channels. You can also output the ITM data to a log file using the ITMLOG or IRLOG commands in the Keil µVision Command Window and analyze that anyway you like, perhaps using custom tools or scripts of own making.
Tracing via ITM is a standardized feature on all ARM Cortex-M3, M4 and M7 MCUs, and will most likely be supported also on future ARM MCUs. Moreover, features for viewing and/or exporting ITM data is available in several IDEs, apart from Keil µVision also in e.g., IAR Embedded Workbench and Atollic TrueSTUDIO.
Why don’t you give ITM a try? It is an important debug technology supported by most ARM development tools, it has many applications in debugging and it is easy to get started!
At Percepio we are quite impressed by the performance potential of ITM and are working on support for ITM-based RTOS trace in our Tracealyzer tools. So stay tuned!
Tracealyzer allows you to trace and visualize the execution of RTOS tasks, exceptions (ISRs), and other software events, providing more than 30 interconnected views that gives an amazing visual insight into the runtime world of RTOS-based firmware, accelerating development, validation and debugging.
Want to learn more about RTOS-based development and Tracealyzer? More articles here!