Think of Percepio Detect as a security camera for your firmware—always monitoring, but only storing data when something unusual happens, such as crashes or performance anomalies. By providing rich debugging information when needed while keeping the overall data volume to a minimum, Detect enables continuous observability over unlimited time, even on resource-constrained devices such as 32-bit microcontrollers.
Detect is designed to provide deep observability into intermittent issues during embedded software development and testing—such as crashes, errors, or performance anomalies—even when they occur outside the debugging environment, reducing the need for manual issue reproduction. It also supports profiling of real-time performance requirements and helps reveal hidden functional risks that might otherwise go unnoticed—for example, near-misses on timing or resource limits.
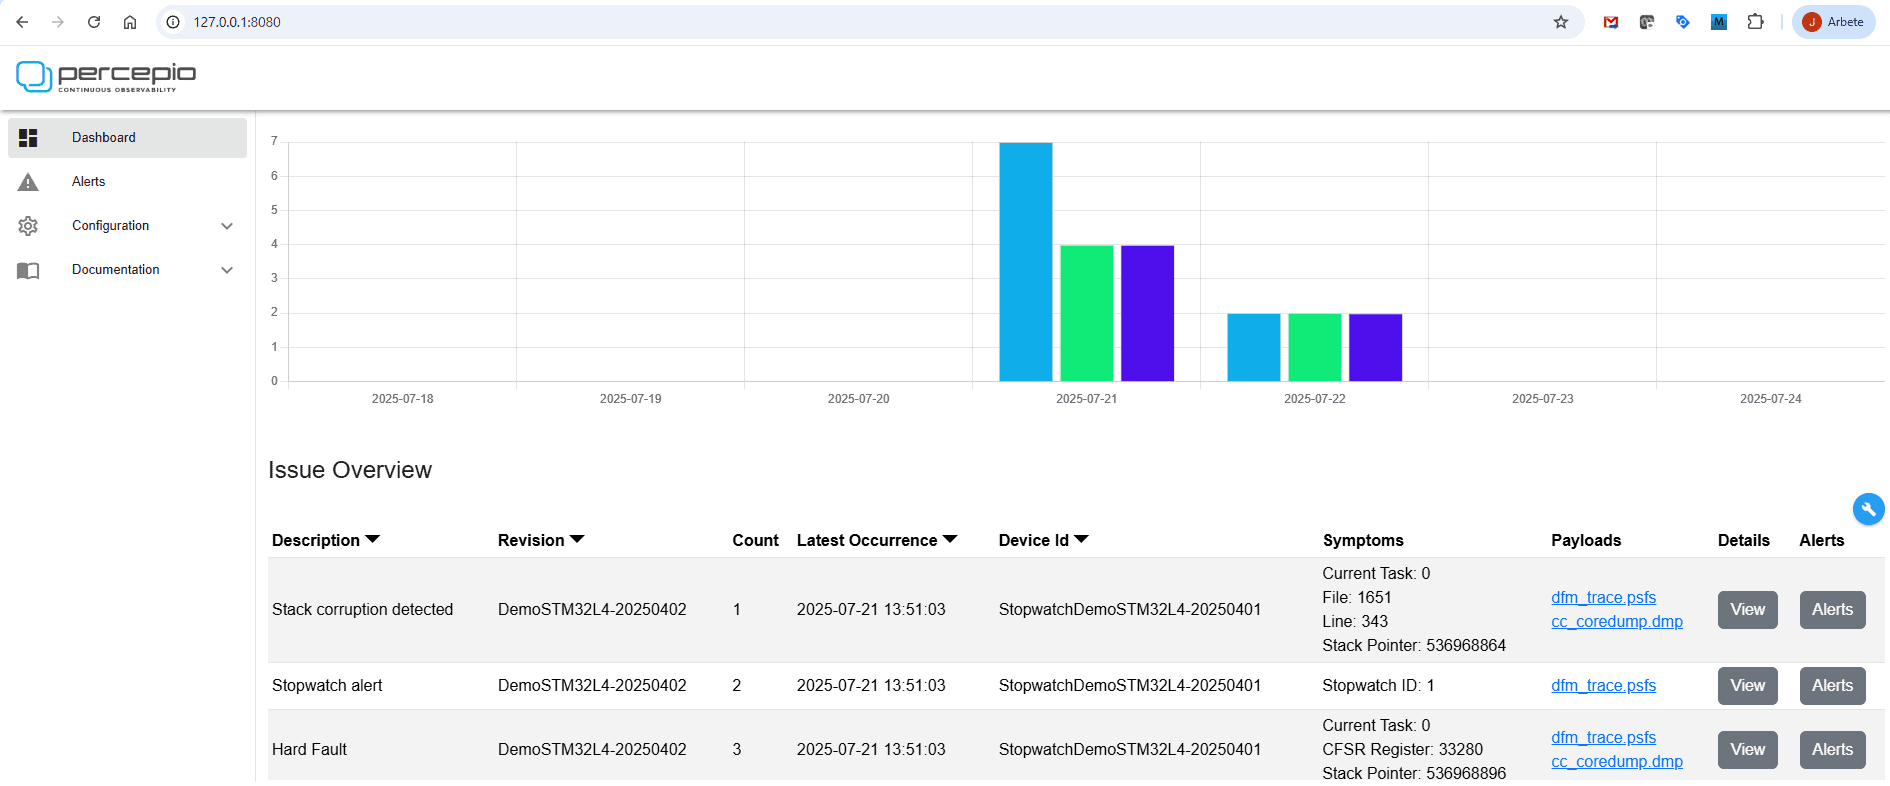
In contrast to the Percepio Tracealyzer stand-alone product, Percepio Detect is designed for automated monitoring of multiple devices and for team collaboration. The web-based dashboard provides a quick overview and easy access to alert analytics, traces, and post-mortem debug sessions for the whole team.
However, unlike most other observability solutions, Percepio Detect is not a vendor-hosted cloud service, but a Docker package that you host yourself. This gives full control over your data and eliminates the need to upload sensitive device data and IP to external service providers.
From a technical perspective, Detect can be seen as a trigger system that stores trace and debug information when specified events or conditions occur—such as processor fault exceptions, a thread exceeding its CPU time budget, or a latency crossing a defined warning threshold. It’s implemented entirely in software, requiring no additional hardware, so it also works on production units without debug ports, even in the field.
Detect integrates Percepio Tracealyzer for visualizing event traces leading up to the detection point, together with a core dump viewer that shows the detailed state of the running thread—such as the call stack, function arguments, and variable values. These two complementary perspectives, when combined in Detect, provide unparalleled insight for post-mortem debugging.
Percepio Detect™ 2025.2 is now available at https://percepio.com/download-detect-eval/. This release includes several improvements for broader platform support, enhanced diagnostics, and easier integration into CI/CT pipelines.
Support for IAR Embedded Workbench
One of the key additions in Detect 2025.2 is general support for IAR Embedded Workbench on Arm Cortex-M devices, including advanced core dumps with call stacks and TraceRecorder snapshots. This brings full post-mortem debugging to IAR users, even during standalone operation without a connected debug probe.
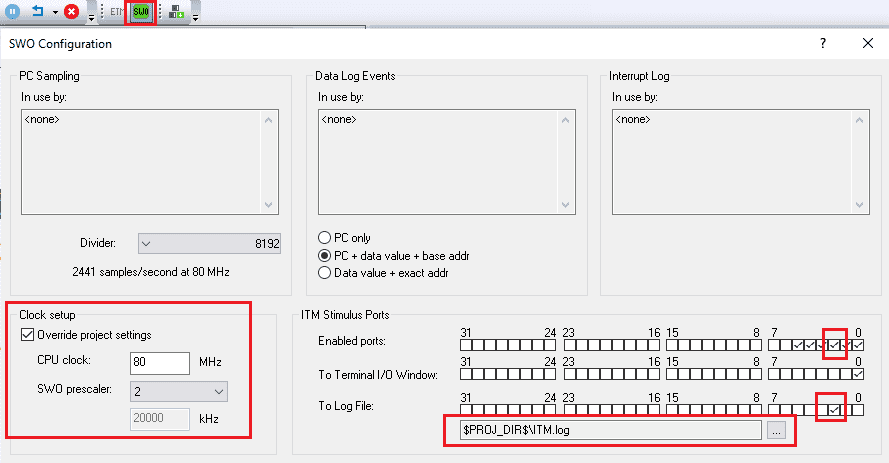
Moreover, the Detect target-side library can now output data via the ITM unit available in many Arm Cortex-M devices. This integrates well with IAR Embedded Workbench for Arm, thanks to its high-performance ITM data logging support. IAR I-Jet supports high-speed SWO in Manchester mode, allowing Detect alerts to be transmitted within just a few milliseconds. This enables low-intrusive reporting of warnings and anomalies with rich diagnostics, without having to halt the device or abort the test.
There is also an interesting opportunity to combine Percepio Detect with IAR C-Run for unified runtime monitoring and diagnostics. The two tools address complementary aspects of runtime behavior—C-Run detects low-level issues within a single thread, such as invalid pointer use or integer overflows, while Detect targets system-level issues involving multiple threads, such as thread starvation and deadlocks. This integration is not yet included in the product but can be provided upon request.
Anomaly Detection with the Detect TaskMonitor
The new TaskMonitor feature is inspired by a customer’s real-world debugging challenge. Their MCU-based device would occasionally freeze in the field, and the only way to recover it was a power-cycle — erasing any diagnostic data before it could be captured. Traditional debugging tools couldn’t help, since you can’t set a breakpoint on something not happening. TaskMonitor was designed to solve exactly that problem: detecting when a system stops responding as expected and automatically preserving the diagnostic trace for post-mortem analysis.
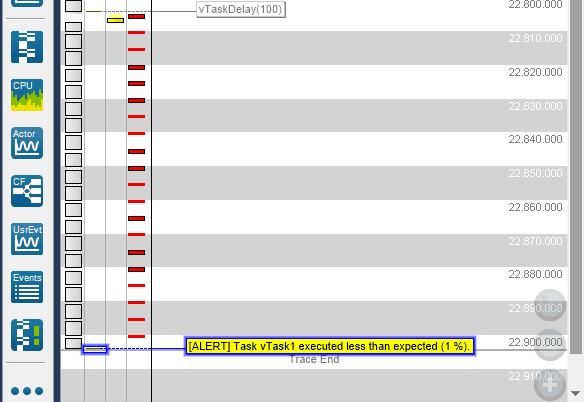
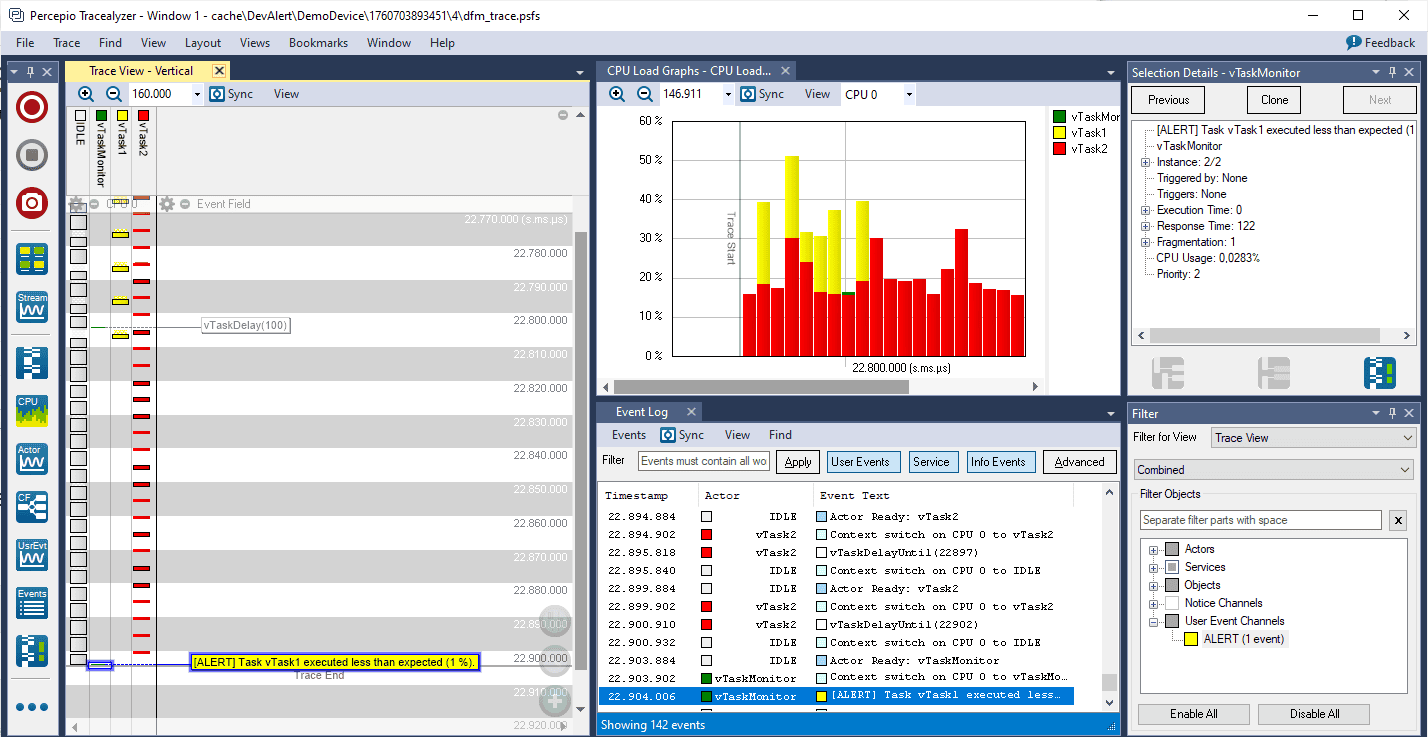
The TaskMonitor feature runs in the target-side C library and tracks each task’s CPU usage as a percentage, maintaining both low and high watermarks. By specifying an expected range, Detect can automatically generate alert messages when a thread consumes more or less CPU time than expected—for example, due to a deadlock. Each alert includes a short Tracealyzer trace showing the most recent events leading up to the detection point. In the example below, the trace data is 3 KB and contains 142 events.
One application of this is performance profiling and optimization. Unlike the profiling support in Tracealyzer, TaskMonitor does not require continuous trace streaming. Monitoring occurs entirely on the target device and runs standalone, with trace data stored only when a violation is detected. This enables long-term monitoring and profiling—over months or even years—both in the lab and in the field. When connectivity is available, violations can be reported in real time; for offline devices, they can be stored locally and downloaded later via a temporary diagnostics connection.
Another important use case is capturing intermittent freezes (hangs) by their side effects on CPU usage—for instance, thread starvation, deadlocks, or priority inversions. These problems are otherwise notoriously difficult to analyze since hard to localize in the code. With Detect 2025.2, you can now automatically capture a trace whenever a specified thread stops running and see why—for example, which blocking system call was involved and what other threads were active at the time.
Optimized Core Dumps with Arm Cortex-M33 support
The core-dump functionality in Detect builds on the open-source CrashCatcher library, which we have improved further and integrated into the Percepio Detect target library. CrashCatcher originally supported Arm Cortex-M cores from M0 up to M7. Our new version adds support for ArmV8-M devices, such as the Arm Cortex-M33, and produces smaller, more efficient core dumps with less configuration required. This is achieved by automatically including the current thread’s stack and only the portion actually in use—determined from the current stack pointer and, optionally, a “start-marker” macro added at the task entry point.
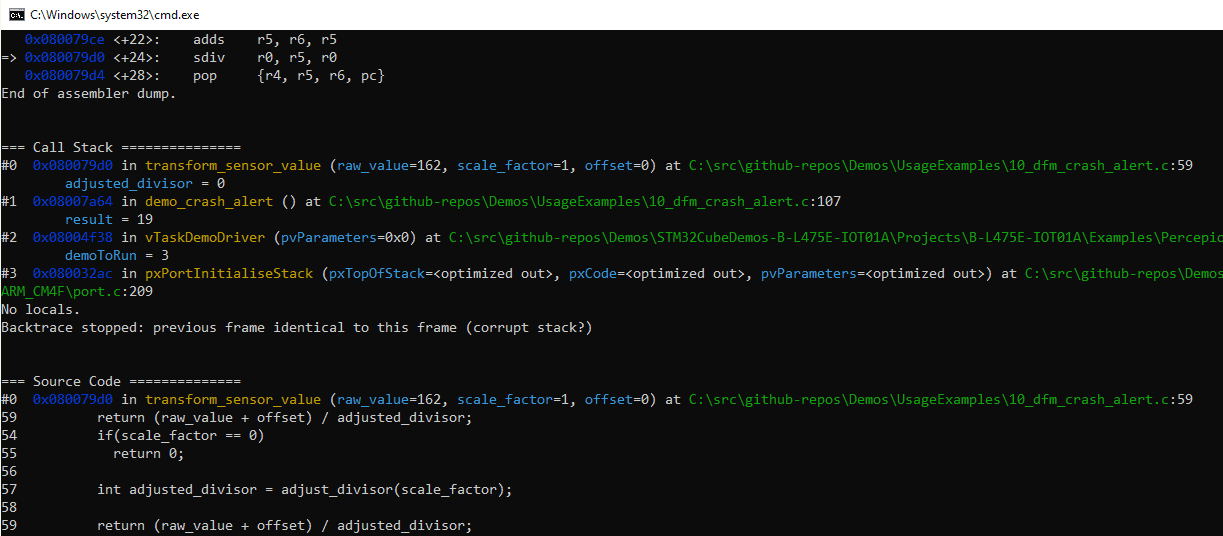
A CrashCatcher core dump mainly contains the processor core registers together one or more memory dumps. This can provide a full dump of the RAM or selected regions only. By loading such core dumps into GDB together with the ELF file, Detect can show the location of fault exceptions, the function call stack, function arguments, variables, fault status registers and other debugging information that help explaining the issue. To see the function call stack, the stack memory must be included in the memory dumps. But you typically don’t want to dump the entire device RAM for efficiency and performance reasons, only the minimal part needed to resolve the call stack. However, in RTOS systems you typically have several stacks, one for each thread, and they might not have symbols you can reference in the CrashCatcher configuration.
Our extension to CrashCatcher instead uses a dynamic scanning approach that uses the current stack pointer to get the lower address of the dump, and then finds the upper address of the stack dump in three steps.
- First, the maximum dump range is obtained by adding the maximum allowed dump size to the stack pointer, by default 300 bytes. If the stack is larger, the earliest part is excluded from the dump, in favor of the more recent function calls.
- Next, we verify that the upper address is not exceeding a configurable upper limit, such as the end of RAM. If so, the dump range is adjusted to end at the upper limit. This avoids CrashCatcher crashing because of reading a reserved memory address beyond the current RAM bank, which might otherwise happen if logging a core dump while the stack pointer is near such a boundary.
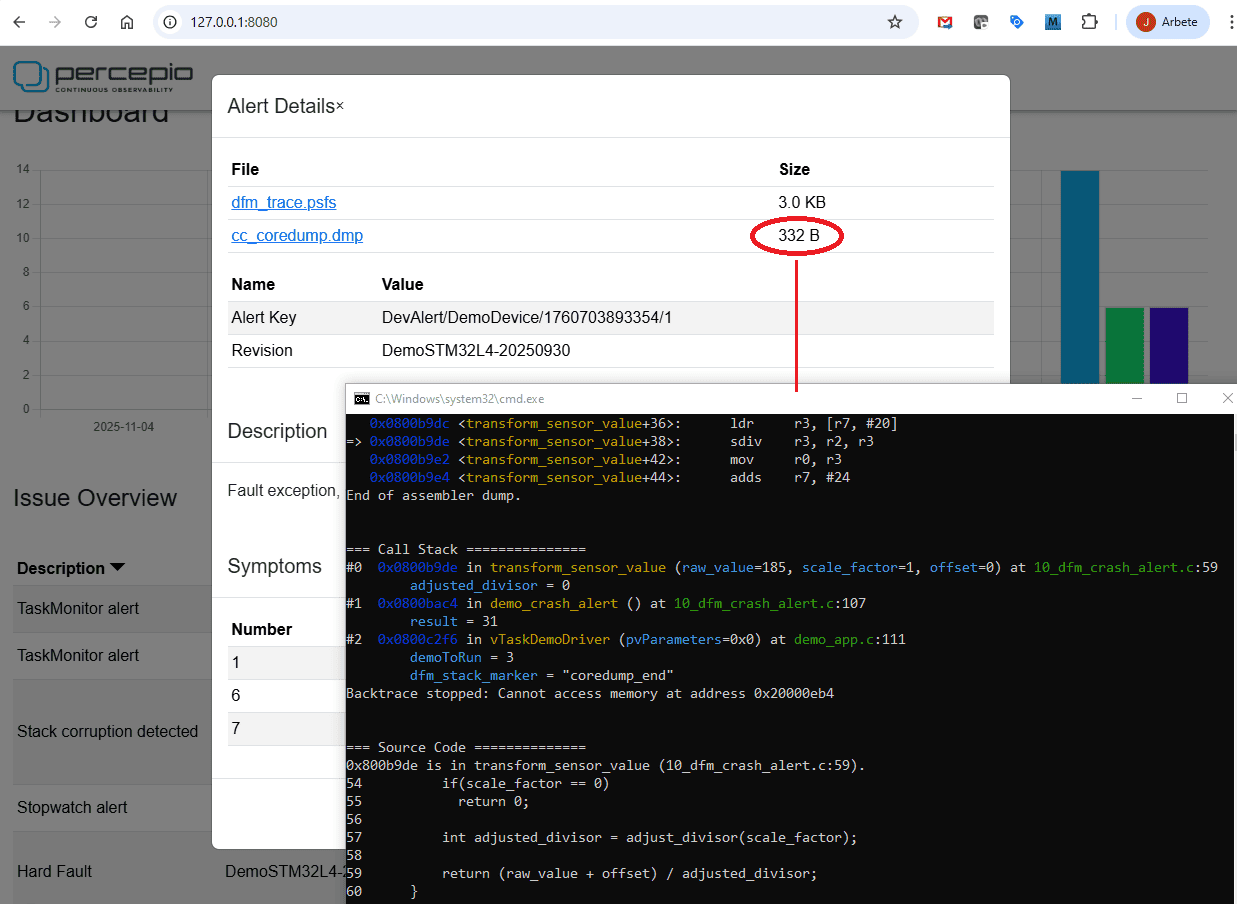
- Finally, the verified dump range from the second step is pruned further by scaning for a “magic” pattern inserted using DFM_STACK_MARKER() as the first code line in each task. When found, the stack dump is ended right after the stack marker. Using DFM_STACK_MARKER is optional but minimizes the dump size and also avoids confusing GDB warnings on FreeRTOS systems and other RTOS where the GDB stack unwinding doesn’t otherwise terminate properly.
As a result, the optimized implementation in Percepio Detect enables significantly smaller core dumps than with statically defined memory dumps. The example seen below is only 332 bytes, while static configurations may require several kilobytes.
As for ArmV8-M support, the main challenge was handling the hardware-based stack overflow monitoring introduced with these cores. They include two new registers, PSPLIM and MSPLIM, defining stack limits for the process and main stacks. If the stack pointer crosses these limits, a UsageFault exception is triggered. The original CrashCatcher implementation can produce false positives on these cores because it switches to its own internal stack during exception handling, which may inadvertently trip the overflow detection and cause a fault exception loop. This issue has been resolved in Detect 2025.2, allowing you to safely use core dumps together with the hardware-based stack limit checking and also use Detect to report and debug such stack overflow exceptions.
New Demos, Code Examples and Documentation on Github
The demo and integration guides have been updated and simplified for the new features. In addition, Percepio now provides a set of Detect and Tracealyzer demos on GitHub, covering all major use cases in the 2025.2 release. There are five Detect examples, each with source code, documentation, and screenshots illustrating key features. Demos are available for IAR Embedded Workbench, STM32CubeIDE, and Microchip MPLAB X IDE.
To try it out, sign up to evaluate Detect at https://percepio.com/download-detect-eval/.
See also the product page at https://percepio.com/detect.
For questions, please contact us here.