Tracealyzer® + Percepio Detect Demos in new GitHub Repo
By Johan Kraft, PhD, Founder and CTO of Percepio AB.
From Reactive Debugging to Continuous Insight
Ask any embedded developer about their worst debugging experience, and chances are you’ll hear stories of unreproducible bugs, late-night watchdog resets, or CI test failures with no trace. Traditional tools often leave us blind at the exact moment we need insight.
That’s why we at Percepio have been investing in Continuous Observability — a principle that combines on-device monitoring with automated data capture on faults and anomalies. This is similar to a flight data recorder like airliners have, but targeting embedded software internals and made entirely in software. This is designed to be included in the target software and active at all times, to let you catch the first signs of trouble early and to get insights that turn nightmare bugs into quick fixes.
With on-device monitoring you can reduce the diagnostic data transfer by several orders of magnitude (99.99…%) as only abnormal behavior is reported. You avoid most data handling costs (data transfer, storage) while getting a lot more data when it really counts. Not only logs, but also core dumps providing full insight on crashes like memory access faults, as well as event traces on multithreading, timing and resource usage issues. When combined, they create a powerful feedback loop that gives you both proactive warnings and deep forensic insight when things go wrong.
To help you explore this for yourself, we’ve launched a public GitHub repository with hands-on demos for both standard Tracealyzer tracing and also for our more advanced solution Percepio Detect, including newly added IAR support in Percepio Detect. Demo projects are included for IAR Embedded Workbench, STM32CubeIDE and Microchip MPLAB X IDE targeting two boards to begin with, the B-L475-IoT01A from STMicroelectronics and the PIC32CK SG Curiosity Ultra Development Board from Microchip. However, the usage examples are generally applicable for any device, except that the core dump library is currently limited to Arm Cortex-M devices.
This first version of the Demo Repository is using FreeRTOS. A similar project for Zephyr will be published in conjunction with the upcoming release of Percepio Detect for Zephyr during fall 2025.
A Guided Tour: Code First, Then Concepts
This is not another wall of documentation. Instead, we invite you to:
- Try it out on your own embedded applications and learn about multithreading behavior, performance bottlenecks, intermittent issues and stability risks.
- Start out with Percepio View free of charge.
- Explore the rich analysis features of Percepio Tracealyzer (free trial here).
- Explore crash debugging and anomaly detection with Percepio Detect (free trial on request)
The demo repository includes executable code examples showing common use-cases, each with a comprehensive explanation and a short guide on how to analyze the examples using the tools.
What’s Different: Tracealyzer and Detect Working Together
Most developers know Tracealyzer as a powerful visualization tool for RTOS execution. But the real magic happens when combined with Percepio Detect, which:
- Watches your system in real time, including during CI test runs or in-field deployments, without needing to stream out loads of data.
- Triggers alerts with core dumps and trace snapshots automatically, when intermittent faults and anomalies (e.g., crashes, deadlocks, timing violations) are detected
- Updates a web dashboard for overview and post-mortem debugging. A single click takes you straight into debugging the actual incident, without needing to spend hours, days or weeks on trying to reproduce it. You can learn what happened before your morning coffee.

Tracealyzer in use together with IAR Embedded Workbench for ARM. One of the many useful views in Tracealyzer showing a state machine graph.
Figure 1: Tracealyzer in use together with IAR Embedded Workbench for ARM. One of the many useful views in Tracealyzer showing a state machine graph.
Why This Matters: From Dev to Test and Deployment
Here’s what you gain from following this approach:
- Faster debugging: Tracealyzer lets you time-travel through your RTOS execution
- Greater test coverage: Detect uncovers timing issues and regression bugs in nightly CI runs by revealing near misses and timing anomalies.
- Production-grade insight: Understand rare edge cases, even in the field.

High-level architecture of Percepio Detect, capturing alerts and logs for visualization in the web browser dashboard
Figure 2: High-level architecture of Percepio Detect, capturing alerts and logs for visualization in the web browser dashboard.
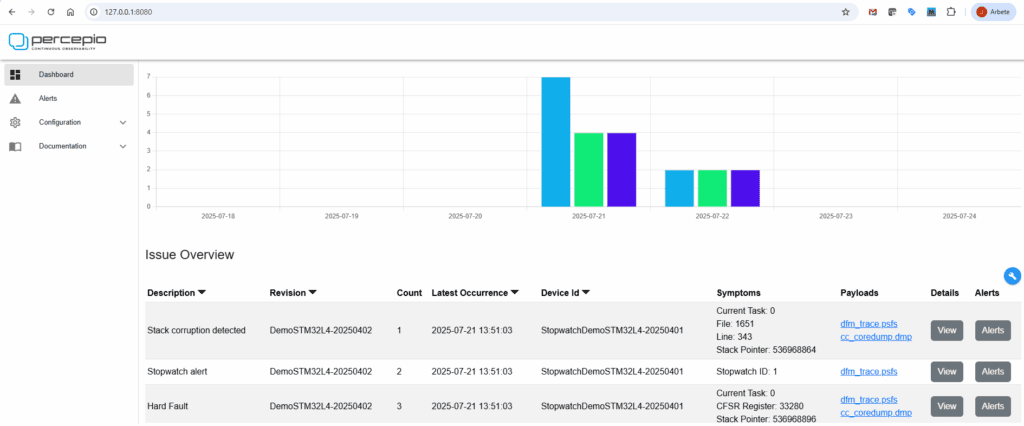
Snapshot of the Percepio Detect server dashboard. Each “alerts” has its associated payload of diagnostics data, easily accessible for analysis by clicking on the links.
Figure 3: Snapshot of the Percepio Detect server dashboard. Each “alerts” has its associated payload of diagnostics data, easily accessible for analysis by clicking on the links.
Try It Now!
Getting started is as easy as:
- Clone the repo and read the instructions:
- Get a supported development board, or simply view the code examples.
- Read the demo descriptions (main readme) and optionally run the demos, if you have a supported board.
git clone https://github.com/percepio/demos
We welcome issues, suggestions, and pull requests — this is a living resource for the Percepio developer community.
Stay Tuned
This is just the beginning. Over time, we are looking at releasing:
- New examples on TraceRecorder and Percepio Detect
- Zephyr support in Percepio Detect
- Examples on how to integrate Detect into your CI workflows