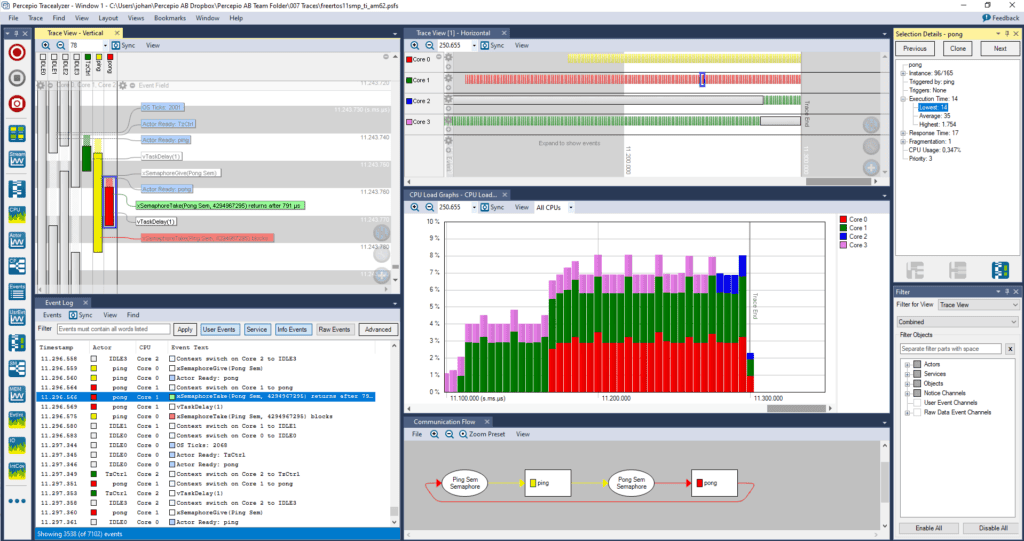
FreeRTOS 11 introduced symmetric multi-processing (SMP) support in the mainline kernel, meaning a single FreeRTOS kernel is managing multiple processor cores. This allows for high performance but also makes the runtime system more complex, meaning higher risk of issues and more difficult debugging.
System tracing with Percepio Tracealyzer can offer an effective remedy by providing insight into the system execution. Tracealyzer has supported FreeRTOS for many years and we have now verified the support for FreeRTOS 11, including SMP systems.
This article provides a guide to get started with Tracealyzer on FreeRTOS 11 SMP applications. The Texas Instruments AM62ax, providing four Arm Cortex A53 cores, is used as demonstration platform. However, most of this document also applies to other multicore processors.
How Tracealyzer displays Multicore Traces
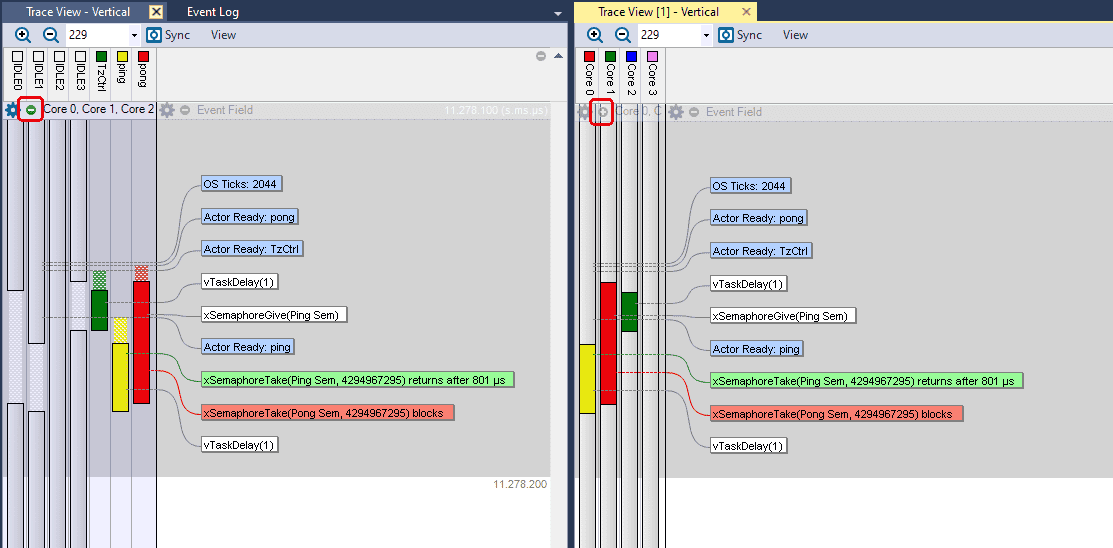
When displaying a multicore trace in Tracealyzer, the default setting is to display all tasks from all cores together, as seen in the left view below.
To see the execution displayed per core, the easiest way is to collapse the task trace by clicking the “minus” button in the top left corner, as seen above. The collapsed mode displays a single column per core, as shown in the right view. If you have many threads, the collapsed mode reduces the number of columns which can make the trace easier to follow.
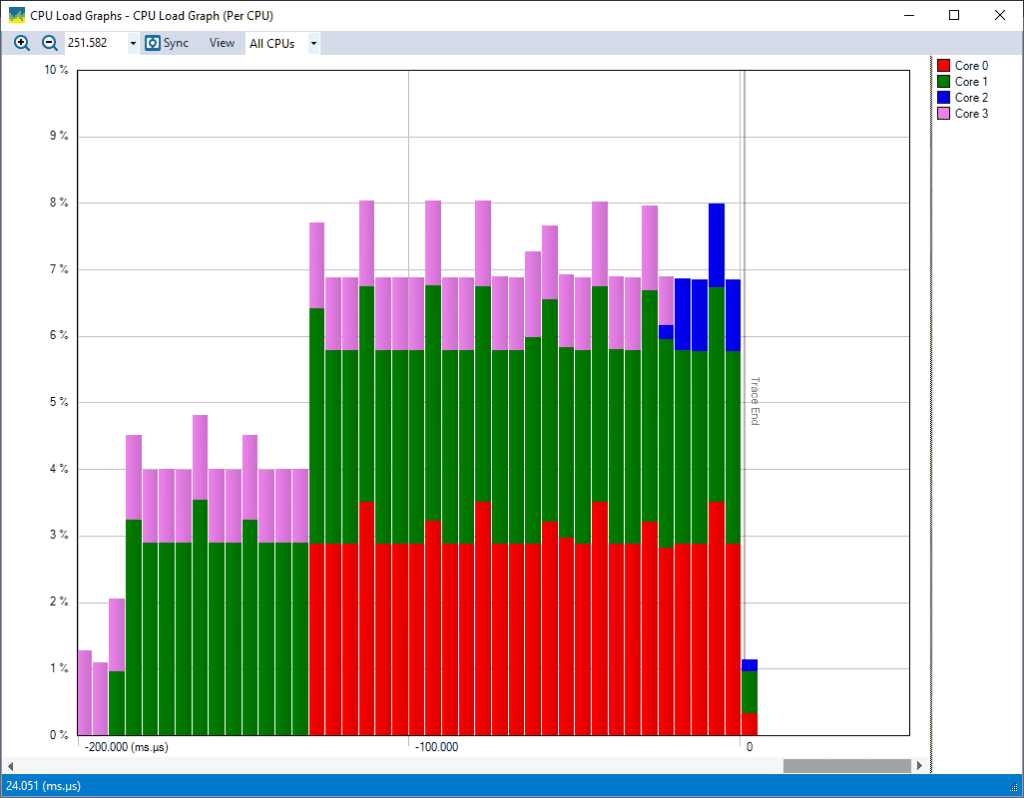
The CPU Load Graph shows the total CPU load per core, as seen in the screenshot below. Note that the CPU load percentages of each core are accumulated, so that if all four cores are running at 100%, the combined load is reported as “400 %”.
To see the contribution of individual tasks, go to the dropdown menu in the menu bar that reads “All CPUs” and select a specific core.
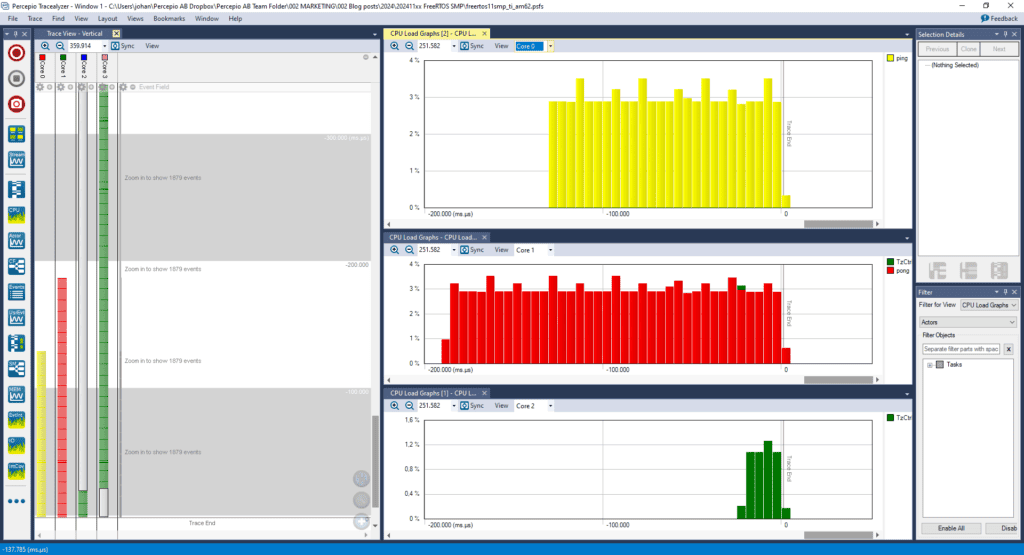
To see the CPU load per task from multiple cores, open multiple instances of the CPU load graph, one per core, by selecting “Clone View” (found in the local “View” menu next to “All Cores”). Then configure each view to shown a specific core.
Setting up TraceRecorder
Percepio Tracealyzer uses a software library for recording traces, Percepio TraceRecorder, that is available on Github. TraceRecorder leverages the FreeRTOS built-in trace hooks to record key events in the FreeRTOS kernel. Moreover, TraceRecorder offers an API for custom logging that allows developers to extract more information from the application.
As an example and starting point, we are using a FreeRTOS SMP demo application found in the Texas Instruments MCU+ SDK for AM62 devices. We won’t go into the specifics of the TI MCU+ SDK just yet but begin with the general setup needed in FreeRTOS and TraceRecorder.
To add TraceRecorder in the example project, follow the general getting started guide while also applying the recommendation in the following section.
For FreeRTOS SMP, the recommended setting is to use snapshot tracing, where trace data is stored in a ringbuffer on the device. Tracealyzer also has experimental support for continuous streaming on SMP multicore systems in certain configurations, but we are not yet satisfied with the performance. An improved solution for multicore trace streaming is planned during 2025.
In step 3 of the guide, you need to specify a “hardware port” for TraceRecorder, a set of #defines that provide the hardware-specific functionality in TraceRecorder.
You select hardware port by updating TRC_CFG_HARDWARE_PORT in the TraceRecorder configuration file (config/trcConfig.h). In many cases, there is an existing hardware port that can be used. You find the list of existing hardware ports in include/trcDefines.h.
In this case we need to make a new hardware port. To specify a custom hardware port, we set TRC_CFG_HARDWARE_PORT to TRC_HARDWARE_PORT_APPLICATION_DEFINED. Then we add custom definitions for the hardware port macros in trcConfig.h, as described in the following section.
Adding Processor Support
Before we can use TraceRecorder on a new processor, the TI AM62x in this case, we need to add processor-specific definitions – a new hardware port. A TraceRecorder hardware port has two responsibilities:
- Protecting critical sections
- Timestamping the events
Protecting critical sections is needed to synchronize access to TraceRecorder data structures. In this case, we can copy the critical section macros from an existing hardware port called TRC_HARDWARE_PORT_ARMv8AR_A32, found in include/trcHardwarePort.h. That is a generic solution for most Arm Cortex-A and -R devices, although for this SMP system the timestamping part was not compatible. Copy the #defines for TRACE_ALLOC_CRITICAL_SECTION, TRACE_ENTER_CRITICAL_SECTION and TRACE_EXIT_CRITICAL_SECTION into trcConfig.h, and also the function declarations for cortex_a9_r5_enter_critical() and cortex_a9_r5_exit_critical(). These functions should work for any Arm Cortex-A and -R device.
For timestamping the events, TraceRecorder uses the TRC_HWTC_COUNT macro to read the current time. This macro should be defined to read a suitable source for timestamping, for example a clock cycle counter. For SMP multicore systems, it is important to use a time source that is shared by all cores. In this case we use the GTC module (global timebase counter) in the TI MCU+ SDK. The GTC counter is read using the GTC_getCount64() function, so in trcConfig.h we add the following definition of TRC_HWTC_COUNT:
    #include "drivers/gtc.h"
    #define TRC_HWTC_COUNT  ((uint32_t)GTC_getCount64())
For other processors you need to provide a similar function. Note that TraceRecorder uses 32-bit timestamps, so the value is type-casted to a unit32_t to only use the lower 32 bits. Counter overflows are detected by Tracealyzer, as long as there is at least one event between each overflow.
The “type” of TRC_HWTC_COUNT counter needs to be specified in TRC_HWTC_TYPE. This is set to TRC_FREE_RUNNING_32BIT_INCR, which means an incrementing counter that goes up to 0xFFFF FFFF and then automatically overflows to 0. See trcHardwarePort.h for further details.
#define TRC_HWTC_TYPE TRC_FREE_RUNNING_32BIT_INCR
Tracealyzer also needs to know the resolution (frequency) of the time source. This is provided in the TRC_HWTC_FREQ_HZ macro. In this case, the GTC is running at 25 MHz (i.e., 25 million increments per second) so we add the following definition in trcConfig.h.
#define TRC_HWTC_FREQ_HZ (25000000)
Finally, we add definitions for TRC_HWTC_PERIOD, TRC_HWTC_DIVISOR and TRC_IRQ_PRIORITY_ORDER, like below. See trcHardwarePort.h for further details.
    #define TRC_HWTC_PERIOD  0        // If using TRC_FREE_RUNNING_32BIT_INCR
    #define TRC_HWTC_DIVISOR  16      // A “prescaler” for the timestamps
    #define TRC_IRQ_PRIORITY_ORDER  0 // For sorting traced ISRs by priority
For multicore systems it is also necessary to add the following in trcConfig.h:
    #define TRC_CFG_CORE_COUNT 4     // The number of cores managed by the FreeRTOS kernel
    #define TRC_CFG_GET_CURRENT_CORE Armv8_getCoreId() // How to get the current core number
By default, TraceRecorder is configured for 32-bit devices. This processor is running in 64-bit mode, so you need to add definitions for TRC_BASE_TYPE and TRC_UNSIGNED_BASE_TYPE that maps them to 64-bit integer types.
    #define TRC_BASE_TYPE int64_t
    #define TRC_UNSIGNED_BASE_TYPE uint64_t
Your updated trcConfig.h should now have the following definitions, with appropriate changes to match your software platform.
    /* Hardware port selection (custom) */
    #define TRC_CFG_HARDWARE_PORT TRC_HARDWARE_PORT_APPLICATION_DEFINED

    extern uint32_t cortex_a9_r5_enter_critical(void);
    extern void cortex_a9_r5_exit_critical(uint32_t irq_already_masked_at_enter);

    /* Critical section definition (copied from TRC_HARDWARE_PORT_ARMv8AR_A32) */
    #define TRACE_ALLOC_CRITICAL_SECTION() TraceUnsignedBaseType_t TRACE_ALLOC_CRITICAL_SECTION_NAME;
    #define TRACE_ENTER_CRITICAL_SECTION() { TRACE_ALLOC_CRITICAL_SECTION_NAME = (TraceUnsignedBaseType_t)cortex_a9_r5_enter_critical(); }
    #define TRACE_EXIT_CRITICAL_SECTION() { cortex_a9_r5_exit_critical((uint32_t) TRACE_ALLOC_CRITICAL_SECTION_NAME); }

    /* Timestamping using GTC on TI AM62x */
    #include "drivers/gtc.h"
    #define TRC_HWTC_COUNT  ((uint32_t)GTC_getCount64())
    #define TRC_HWTC_TYPE  TRC_FREE_RUNNING_32BIT_INCR
    #define TRC_HWTC_FREQ_HZ  (25000000)
    #define TRC_HWTC_PERIOD  0
    #define TRC_HWTC_DIVISOR  16
    #define TRC_IRQ_PRIORITY_ORDER  0

    #define TRC_CFG_CORE_COUNT 4 // The number of cores managed by the FreeRTOS kernel
    #define TRC_CFG_GET_CURRENT_CORE Armv8_getCoreId() // How to get the current core number
    /* Since 64-bit device */
    #define TRC_BASE_TYPE int64_t
    #define TRC_UNSIGNED_BASE_TYPE uint64_t
Congratulations, you have made a custom hardware port for TraceRecorder! You can now proceed with the remaining steps of the getting started guide. But make sure to read the following section as well.
Initializing TraceRecorder on Multicore systems
TraceRecorder needs to be initialized before any FreeRTOS functions are called. Note that the system initialization function may create FreeRTOS objects in the early startup phase. If this happens before TraceRecorder has been initialized, it may cause errors or crashes.
This can be solved by calling xTraceInitialize() as early as possible, before any other initialization functions are called. However, make sure to only do this once, on Core 0, for example like this:
    if (Armv8_getCoreId() == 0) {
        (void)xTraceInitialize();
    }
The same applies when calling xTraceEnable() to start the tracing. Make sure this function is only called once, on Core 0, for example like this:
    if (Armv8_getCoreId() == 0) {
        (void)xTraceEnable(TRC_START);
    }
If all cores share the same main() function, you may need to ensure TraceRecorder has been initialized before other cores are calling FreeRTOS functions. This can be solved by adding a blocking wait loop for the other cores, for example like so;
    if (Armv8_getCoreId() != 0) {
        /* Cores 1-3 wait here until core 0 initialization is finished. */
        while(ullPortSchedularRunning == 0);
    }
Specifics for Texas Instruments MCU+ SDK and Code Composer Studio
Updating project files: When updating the project to include TraceRecorder, you may want to put your changes in the template files so they are not lost if you re-generate the project build files.
When adding TraceRecorder in the MCU+ SDK for the TI AM62x, we updated the following files:
- .project/templates/am62ax/freertos/FreeRTOSConfig_smp.h.xdt
- .project/templates/am62ax/freertos/main_freertos_smp.c.xdt
- source/kernel/freertos/.project/project_am62ax
- examples/kernel/freertos/smp_task_switch/.project/project_am62ax.js
Saving traces: You can use the Code Composer Studio (CCS) debugger to save trace data to a host file. Select “Memory Browser” -> “Save Memory”, select Binary format and enter the following address range:
-
Address: RecorderDataPtr
-
Size: sizeof(*RecorderDataPtr)/sizeof(uint32_t)
Name the file “something.bin” and open it in Tracealyzer.
Learning More
Learn more about Tracealyzer on the product page and on the getting started page.
If you have questions or issues getting started, contact us here.


