Embedded Software Observability
Debugging embedded software has never been easy, but today’s systems are more complex and interconnected than ever. Real-time operating systems (RTOS) and continuous integration pipelines can make development faster—but certain classes of bugs are hard to reproduce and diagnose. These elusive issues often appear only under rare conditions, such as timing-sensitive race conditions or field-only failures.
This is where Continuous Observability®, powered by Percepio Detect, changes the game. By combining on-device anomaly detection with secure, automated snapshots, developers can finally gain the visibility needed to move from reactive firefighting to proactive quality assurance in RTOS-based firmware development.
The Pain of Late Discovery
The later a bug is found, the more difficult and expensive it becomes to fix. Developers often receive vague reports from testers or field users: “The device crashed, but we don’t know why.” Without sufficient runtime diagnostics, reproducing and resolving the issue becomes guesswork.
For RTOS-based applications, the problem is even more pronounced. Bugs like deadlocks, race conditions, memory leaks, and priority inversions may surface only occasionally, making traditional testing and logging ineffective.
Continuous Observability in Practice
Continuous Observability integrates lightweight monitoring into your firmware. Instead of streaming massive amounts of data, Percepio Detect runs quietly in the background, detecting anomalies such as crashes, hangs, or performance anomalies. When something unusual happens, Detect captures a detailed snapshot of the system state at the fault—including the most recent RTOS events and the call stack on the current thread.
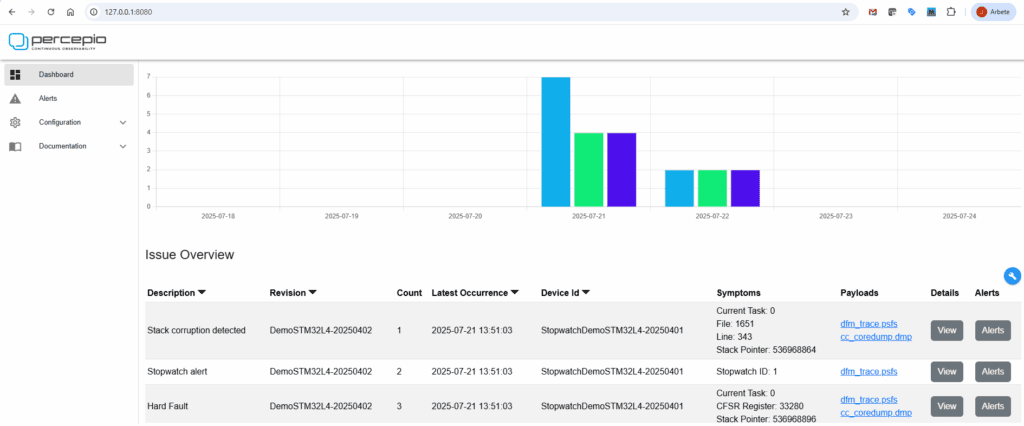
Snapshot of the Percepio Detect server dashboard. Each “alerts” has its associated payload of diagnostics data, easily accessible for analysis by clicking on the links.
From Lab to Field
In testing: Detect integrates with your CI pipelines, enabling automated detection of elusive bugs and crashes that may occur during nightly builds or stress testing. Moreover, Detect can also reveal hidden risks, like if sometimes close to a dangerous limit, like a watchdog reset. Engineers arrive in the morning to a dashboard with flagged anomalies and links to full diagnostic payloads—ready for rapid root cause analysis.
In the field: When deployed devices encounter unexpected issues, Detect can securely log snapshots for remote retrieval, even if connectivity is intermittent. This ensures no issue goes undiagnosed, and no customer problem turns into a blind spot.
Deep Dive Scenario
- Scenario: An intermittent crash on a Cortex-M4 device using FreeRTOS, caused by a rare priority inversion.
- Detect workflow: When the crash occurs, Detect records a snapshot and a short trace of the events leading up to the failure.
- Analysis: Opening the trace in Tracealyzer, the engineer sees that a lower-priority thread was blocking a resource needed by a critical task, causing a watchdog timeout and system reboot. With this insight, the issue is reproducible and fixed within hours, instead of weeks.
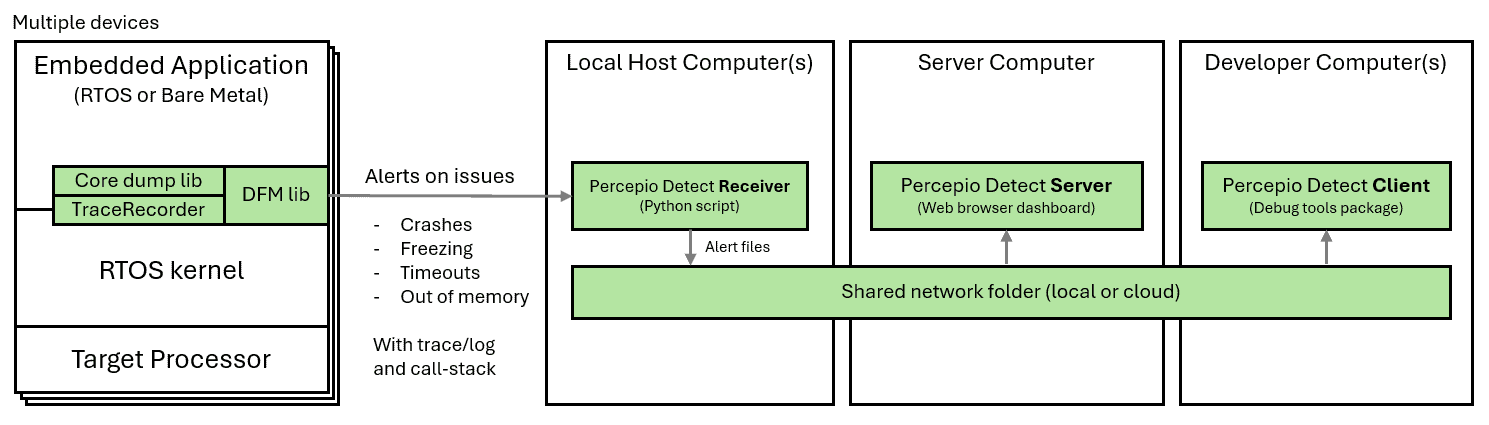
High-level architecture of Percepio Detect, capturing alerts and logs for visualization in the web browser dashboard.
Secure, Scaleable Diagnostics
Unlike some observability platforms that require uploading memory dumps and ELF files to an external cloud service, Percepio Detect keeps sensitive diagnostic data in your control. The data can be shared in the team using the Detect server dashboard, while remaining on your infrastructure, preserving IP security and compliance with privacy regulations like GDPR.
This architecture scales seamlessly from lab setups with a handful of devices to production environments with thousands of connected units, without compromising security.
Why this Matters
By adopting Percepio’s Continuous Observability, development teams:
- Catch critical issues earlier in the lifecycle
- Shorten debugging cycles with actionable, visual diagnostics
- Improve reliability and safety in deployed devices
- Reduce the cost and risk of late-stage failures and recalls