Tracealyzer version 4.3 is now available, with many new features. In total, over 160 improvements have been made since v4.2. Here are the highlights.
Stack Usage Analysis
The new stack usage analysis allows for inspecting the amount of unused stack space for each task. Armed with this info you can optimize the task stack sizes and free up precious RAM for other important features, while making sure you have a sufficient margin to avoid stack overflows. The screenshot below shows the new Stack Usage view, as well as the individual stack usage events.
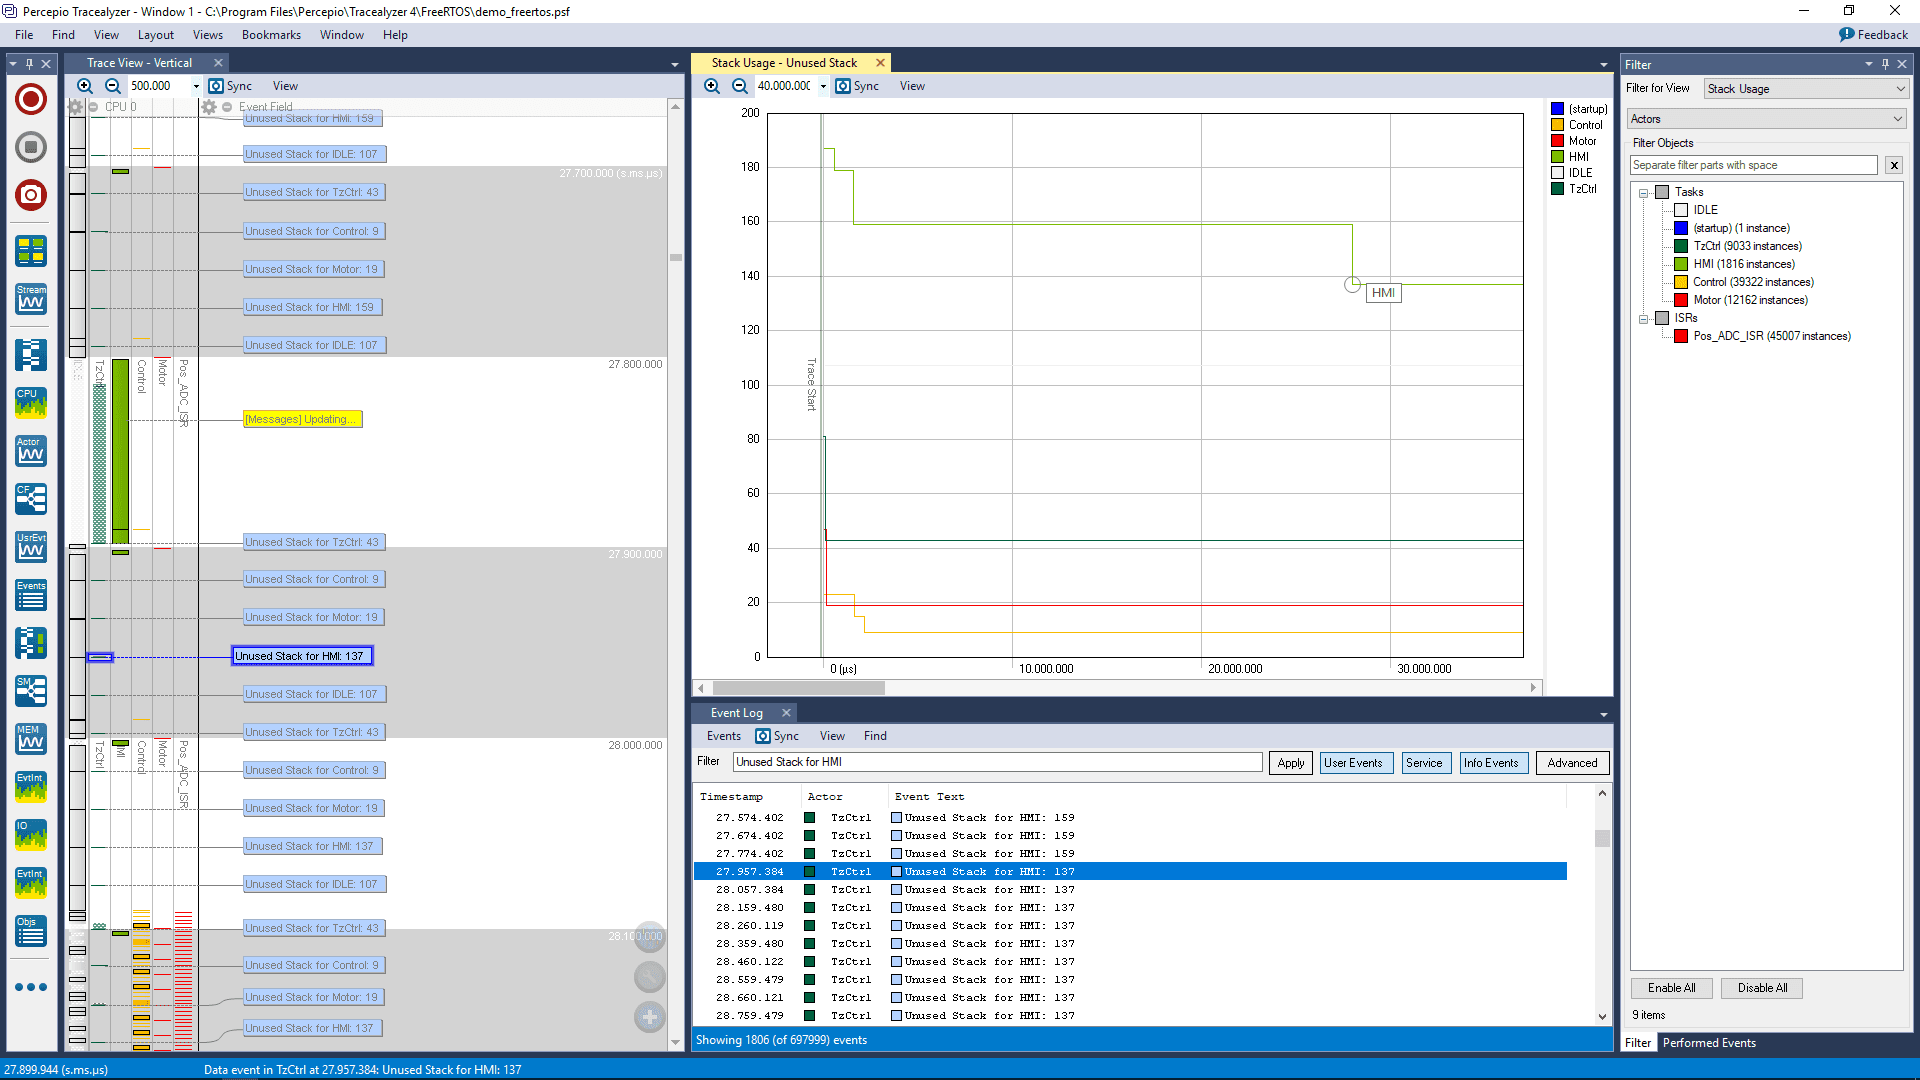
The stack usage is sampled at periodic intervals, so you can see roughly when the stack usage increased (i.e., somewhere in between two samples) and what was going on in your system during this period. This can be shown in a live real-time display when using streaming trace, or based on a previously recorded trace from streaming or snapshot mode.
The stack usage analysis can be used over very long test runs for higher confidence, in both streaming and snapshot mode. The stack usage analysis supports Amazon FreeRTOS and Micrium µC/OS-III at the moment. The stack usage analysis can also be used in our upcoming Device Firmware Monitor service for monitoring of deployed IoT firmware in the field.
Major Performance Improvement for Long Traces
Tracealyzer v4.3 brings an important performance improvement when recording really long traces. Loading a section from the Trace Preview is now a lot faster than before, thanks to improved indexing, which makes it practical to use for long-running tests spanning many hours or days.
The improvement requires some explanation of how Tracealyzer deals with large traces. As you might know, Tracealyzer allows for recording traces in streaming mode over unlimited durations, as long as you have disk space. A more urgent limiting factor is however the memory usage when loading the trace data. The “Unlimited Tracing” support in Tracealyzer provides two features that allow you to record really long traces, without being limited by the amount of memory in your computer.
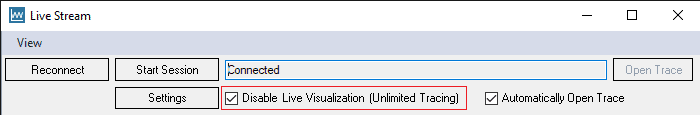
First, you need to check the “Unlimited Tracing” box in the Live Stream dialog (see below). This disables live visualization, which avoids that your computer’s memory is filled with trace data while recording. In this mode, you can record for hours, days, even weeks if you like. Disk space is usually no problem, since the data rate is often only a few hundred MB per hour.
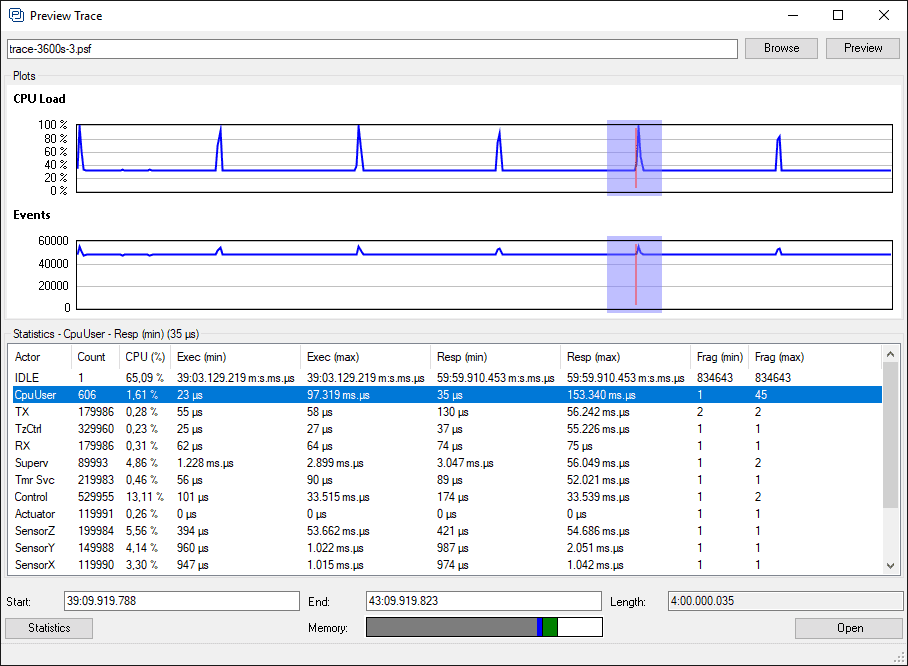
Next, when opening the trace, Tracealyzer automatically detects if the trace data seems to be too large for the available memory. In that case, it opens the Trace Preview dialog (see below) instead of trying to load the trace in full. In the Trace Preview you can select and load any relevant section of the trace, with guidance from high-level metrics such as CPU load and task response times. The Trace Preview typically loads in an instant, since based on an index of the trace data. This index is normally generated while the trace is being recorded, but can otherwise be generated in a few minutes.
In Tracealyzer v4.3, you can load short selections from the Trace Preview in just a few seconds. In earlier versions, Tracealyzer needed to scan the entire file up until the selected section, which could take considerable time – over 2 minutes was noted for a 1,3 GB trace. With Tracealyzer v4.3 the same section loads in 2-3 seconds and this load time is independent of the total recording length, due to the improved index structure, so only the selection length matters.
However, make sure to keep your index files that were created during the recording, i.e. the .tzpd and .psfi found next to your .psf trace file, otherwise they need to be regenerated. Index generation has also been improved in v4.3 and is about twice as fast as before, but a full indexing can still take a few minutes.
Improved Analysis for State Machines and Custom Intervals
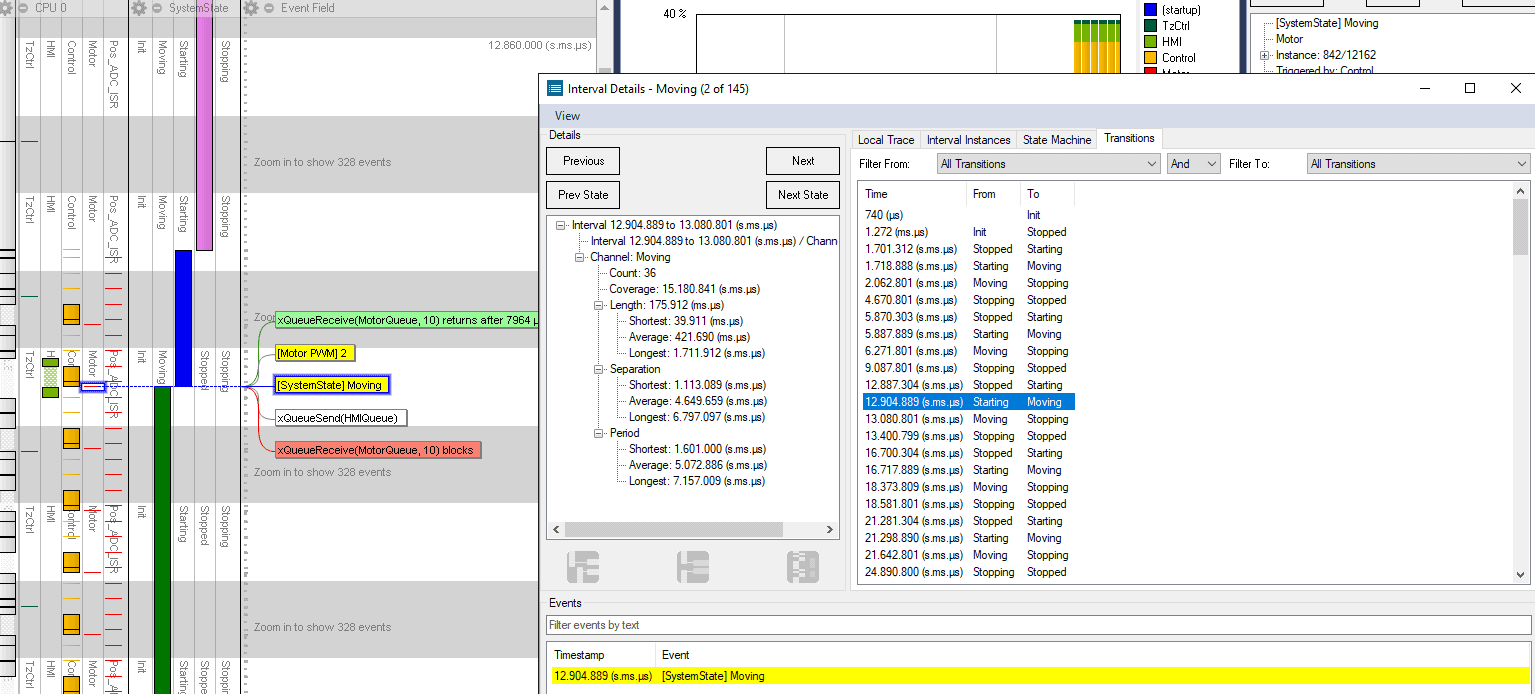
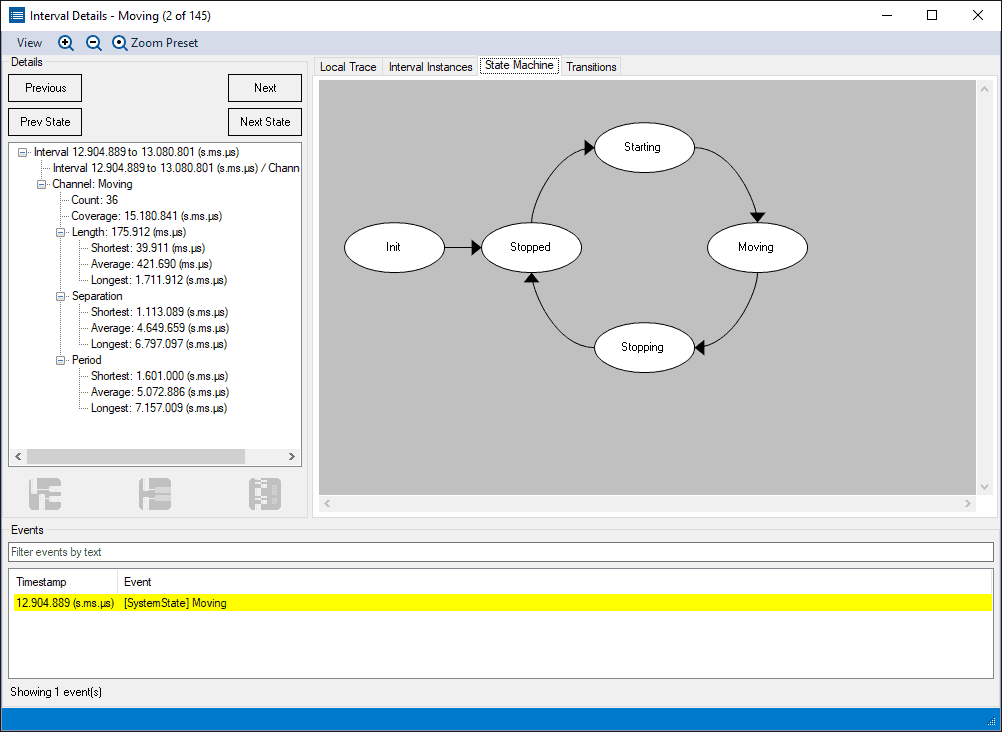
As you might know, Tracealyzer allows visualizing state machines (based on logged state transitions) and can also display custom intervals between specified events. Both states and custom intervals are represented as “Intervals” in the trace view. A new feature in Tracealyzer v4.3 is the Interval Details view that gives an overview of specified state machines/intervals. It works just like you would expect in Tracealyzer – it pops up when you double-click on an Interval entry in the trace (e.g. “SystemState” in the screenshot below). This shows statistics, lists of all matching occurrences, and buttons to jump to the next or previous entry. For state machines, you can also see a list of all state transitions in the “Transitions” tab, which makes it easy to locate them in the trace. Just double-click and the corresponding event is highlighted in the trace view. You can filter the list to pinpoint a specific state transition.
In the “State Machine” tab you find the “State Machine Graph” view, which is accessible from the Views menu. The graph layout engine has been improved to work better with circular state machines, as shown below.
And more…
- All point graph views, like the User Event Signal Plot, can now be exported to CSV text files that can be imported into many other applications.
- Automatic Event Filtering in the trace view allows for selective display of important events, when all events don’t fit in the window. Can be customized in the Settings dialog.
- New “In View” buttons for quick access to important display options, such as adding new view fields.
- For multi-core systems, Tracealyzer now shows task migration between different cores.
- State machines are now saved between trace loads.
- Added a “Find” in the Settings dialog, to help users find settings faster.
- It is now possible to scroll past start/end of trace, making it easier to see things at the very start or very end.
- Improved stability when recording a streaming trace.
Tracealyzer 4.3 is a free upgrade for current users of Tracealyzer 4. New users can download it from percepio.com; a free, time-limited evaluation license is included with every download.