Embedded software developers often add logging points for debugging, “printf debugging”, but this can be a pitfall when debugging RTOS-based applications. The logged messages are typically transmitted over a relatively slow UART interface. This brings a large overhead (milliseconds per call) that can disrupt the system behavior, introduce new issues and obscure the issue you are debugging.
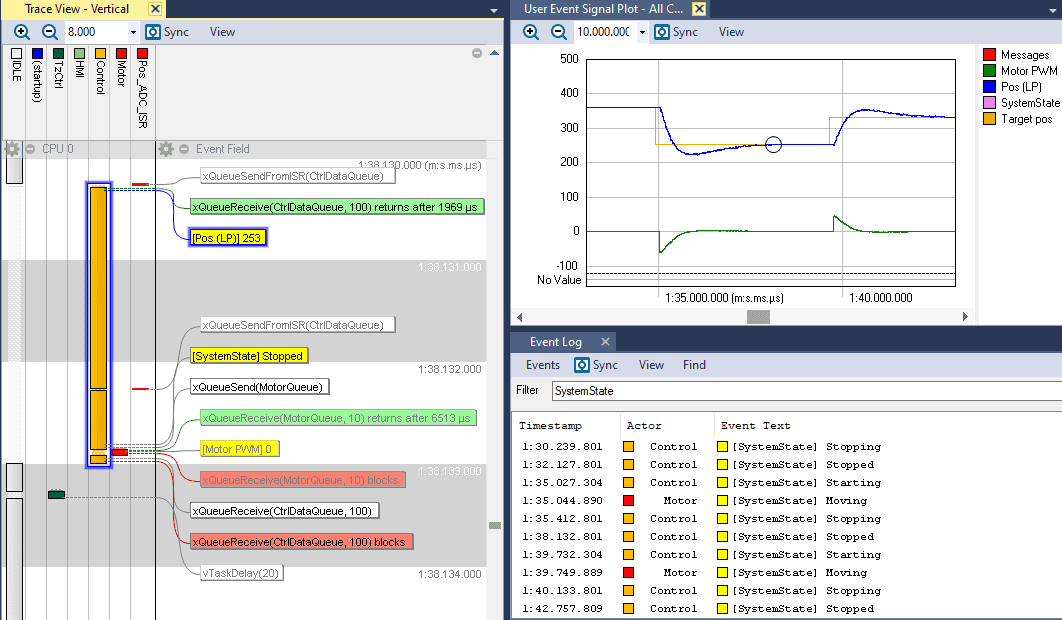
Tracealyzer offers a more efficient logging solution, “User Events”, which are much faster than printf. Moreover, the logged messages are displayed in the Tracealyzer application together with the thread execution, meaning you can see the software activity between your logging points. This also supports data logging with integrated plotting capabilities.
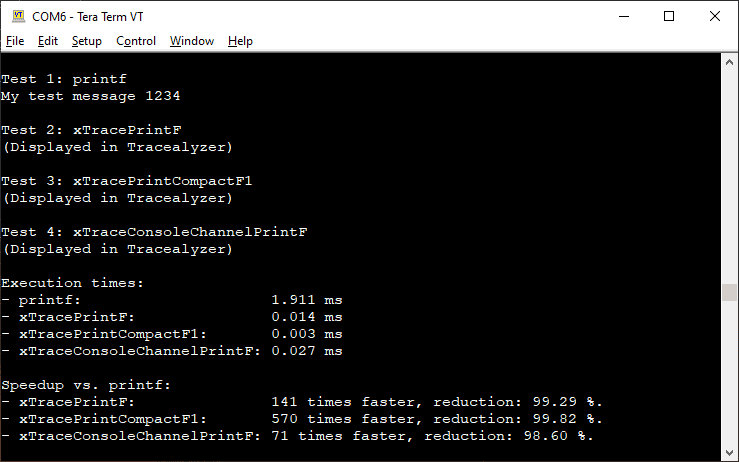
These functions are similar to the stdio printf function, but are much faster. A performance comparison was made using the example message printf("My test message %d\n",1234) and three logging functions in TraceRecorder. The results are shown below.
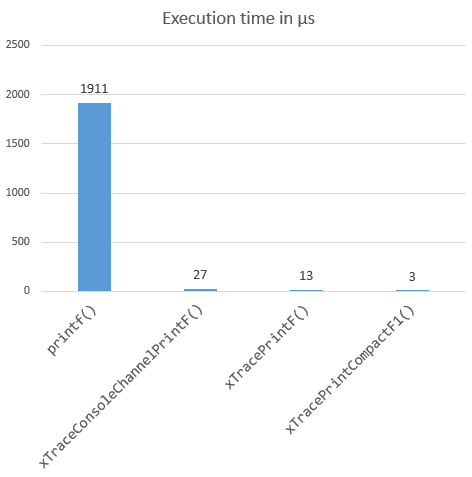
The printf took 1.9 milliseconds. The fastest TraceRecorder logging function reduces the performance overhead by 99.8% and had an execution time of just 3 microseconds, a whopping 570 times faster than the printf call.
This ensures accurate debug logging with minimal risk of disrupting the system. Moreover, the logging can be more detailed since you can afford more logging points. You can even use such logging in time-critical code such as interrupt handlers, although the user should be wary of the small but non-zero overhead.
The measurements was made using an STM32L4 device running at 80 MHz. The printf calls were routed over the STLINK UART running at the default speed, 115200 baud.
The three TraceRecorder logging functions we tested have slightly different purposes:
xTracePrintF is similar to printf but offloads the string formatting to the host side Tracealyzer tool. The data arguments are provided separately from the format string and Tracealyzer can show the data arguments in the User Event Signal Plot graph. However, only a subset of the printf formatting options are implemented in Tracealyzer so far (integers and strings). The logged strings are limited to about 60 bytes, depending on the number of data arguments. Too long strings are truncated.
xTraceConsoleChannelPrintF is a drop-in replacement for printf and supports the same string formatting options. It formats the string in runtime using a stdio function. The message is logged as a flat string so Tracealyzer is not aware of the data arguments, meaning they are not displayed in the User Event Signal Plot. The logged strings are limited to about 60 bytes. Too long strings are truncated.
xTracePrintCompactF1 is optimized for speed and is super-efficient. This function and it’s siblings (e.g. xTraceCompactF0, F2, F3, for different number of arguments) uses a more efficient approach. Instead of logging the characters one by one, it logs the memory address and Tracealyzer then resolves the string from the firmware image file on the host side (the .elf file in your build directory). This only support logging constant strings, but the string length is not limited in this approach.
To use the xTracePrintCompact functions, add a call to xTraceDependencyRegister("filename.elf", TRC_DEPENDENCY_TYPE_ELF); right after your xTraceEnable call. Tracealyzer will then look for this elf file when loading the trace. You can set what folders to search in the Tracealyzer settings. Open the “Definition File Paths” page and add the folder path where your elf file is found, e.g. in the Build folder.
An alternative to direct printf calls is deferred logging. In this approach, you have a separate logging thread that takes care of all the printf calls. This is better than direct printf calls from each thread, but the UART output is still a bottleneck and it is not certain that all logged messages are transmitted in this way. Messages can be dropped if the logging buffer becomes full and on system crashes you might not see the last messages. This can give the wrong picture when debugging.
With TraceRecorder logging you ensure minimal logging overhead and you can also see the detailed thread execution together with the logged messages, meaning you can see what is going on in between your logging points. Moreover, unlike UART-based printf logging the logging performance scales with the with the processor speed. The faster processor, the faster logging.
For Tracealyzer RTOS integrations using Percepio TraceRecorder (e.g. FreeRTOS and Zephyr), the logging API and documentation can be found in include/trcPrint.h.