Are you using Tracealyzer today but find yourself wishing that we should have added that special missing feature? Maybe you want to trace an external library that’s really important for your project? Or you have a trove of traces from another source that you want to present using Tracealyzer’s many information-rich views?
We hear you. And over the next few months we are going to enable embedded and IoT developers to do all this and much more themselves, without having to wait for a new release of Tracealyzer.
Percepio is step by step opening Tracealyzer for third-party integrations via a public software development kit (SDK), intended to enable Tracealyzer support for any embedded software platform. Some things, for example the documentation on how to port Tracealyzer to other RTOSes, are currently only available for partners on request but over time the specifications and code mentioned here will be publicly available for anyone to take advantage of.
Tracealyzer Extension System

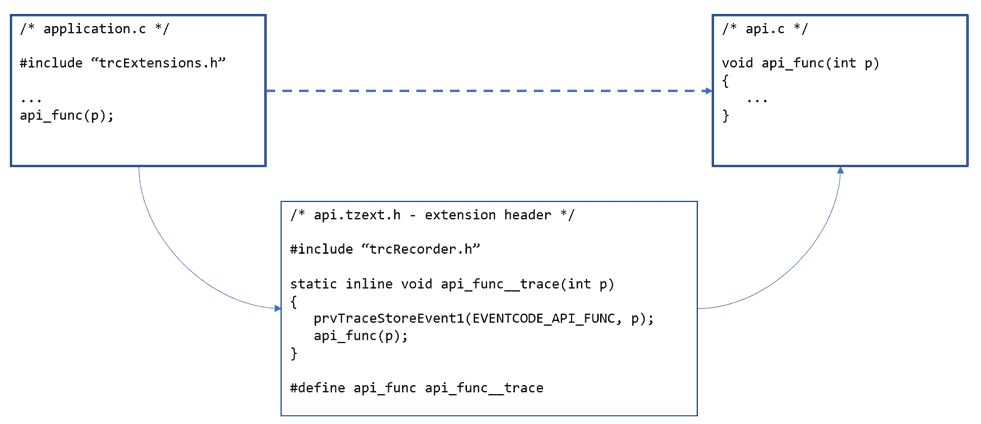
The extension system replaces API calls with calls to wrapper functions that add trace logging before calling the original function.
The trace recorder library now has an extension system that allows a developer to set up automatic recording of all calls to selected library functions, for e.g. middleware or driver APIs. All you need to do is to add an #include statement in your application code, referencing any library header files that you want to enable tracing for. The extension system will then insert a tracing wrapper between your code and the traced library functions, leaving the original functions unchanged.
A Tracealyzer extension is a self-contained module that is easy to integrate for application developers. We imagine that semiconductor and middleware vendors will find this useful, as a way to add API call tracing to their software stacks with very little effort. The system is designed to allow multiple extensions, even from different vendors, to co-exist in the same embedded application.
We’ve covered the extension system before, in this blog post, and there is also a Percepio App Note with even more details. And you don’t have to wait for your vendor to pick it up, you can start experimenting with Tracealyzer extensions right away. As long as you have access to the header files, you’re good to go.
Automatic instrumentation
Looking a bit further ahead, we have a tool under development that will generate Tracealyzer extensions for an API. This tool, tentatively named Tzin (for Tracealyzer Instrumentor), can be used for all sorts of APIs where tracing is desired – application, middleware and RTOS APIs. We plan to eventually include RTOS kernel events in the instrumentation, to further assist with RTOS porting.
Tzin works now and we are testing it internally, but it needs some additional features and a lot of polishing and testing before we can release it for general consumption. The plan is to make it available this fall.
Open API for data
For developers who already have a solution for trace recording but need a proper visualization tool, we are working on a host-side API for feeding trace data into Tracealyzer. This is one of the new features in Tracealyzer version 4.3, which we will release later this month.
The API is socket-based, with a client-side library and code examples that makes it easy to use. All messages are exchanged using either XML or JSON syntax. The client code will be provided with a liberal license, allowing integration in other tools.
Note also that the API will allow both snapshot and streaming mode tracing, and that it supports tracing of multi-core systems.
New License
Finally, we will introduce a new licensing option for Tracealyzer, called Tracealyzer CORE. The CORE license provides a clean Tracealyzer installation with just the SDK package, and allows you to make your own Tracealyzer integration or use a third-party integration leveraging the Tracealyzer SDK.
Contact us at info@percepio.com if you’re interested in trying these tools.

