“Tracealyzer has doubled our development speed. Problems that would take days to solve are obvious with this tool and just a quick fix. We use it all the time.” — Alex Pabouctisids, Lead Firmware Engineer, Flyability
Fed up with endless hours debugging complex embedded systems? Bid farewell to tedious troubleshooting and welcome accelerated development with Tracealyzer. Speed up everyday debugging and solve the more complicated issues in a tenth of the time otherwise needed.
Debugging is akin to detective work: without enough evidence or witnesses, starting an investigation is challenging. Tracealyzer acts as your “surveillance camera,” simplifying debugging with clear insights from the runtime system.
- Get the full picture with trace visualization showing threads and key events.
- Get the right picture with ultra-fast logging – like printf but 99% less intrusive.
- Debug application algorithms with integrated data plots and state diagrams.
- Pinpoint bugs in visual overviews making runtime anomalies easy to spot.
Tracealyzer can be used together with breakpoint debugging to get the best of both worlds. Moreover, Tracealyzer supports real-time streaming without halting the target device. This is crucial for real-time control systems or communication protocols, where halting debug may cause other connected devices to fail.
Get the Full Picture with Trace Visualization
Embedded software often has many threads active at the same time. When bugs involve multiple threads, traditional debugging tools falls short. With Tracealyzer you see every thread in your system, when they are running, in what order and for how long. You also see important events within the threads, such as traced API calls and debug logging that explains what the threads are doing. The advanced visualization makes it far easier to understand why the code behaves the way it does. This is key to effective debugging.
With breakpoint debugging you only get snippets of information from one thread at a time. You don’t see the other threads running in between. It’s a bit like watching a football game through binoculars. It gives a too narrow view that can make debugging very difficult.
Get the Right Picture with Ultra-Fast Logging
Debugging with printf-logging is still a common practice, but this is not suitable for RTOS-based applications. A single printf call over a UART interface can take several milliseconds and disrupt the system behavior. Such a large “probe effect” can introduce new issues or obscure the issue you are debugging. This may lead your debugging in the wrong direction.
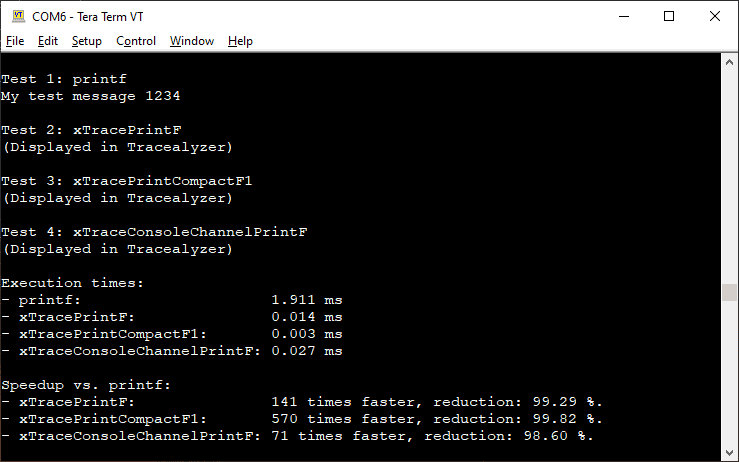
Tracealyzer provides ultra-fast logging functions that slashes the overhead by 99% to ensure you get the right picture. Moreover, lets you afford more detailed logging, even in time-critical code with minimal impact. See our performance comparison for more details.
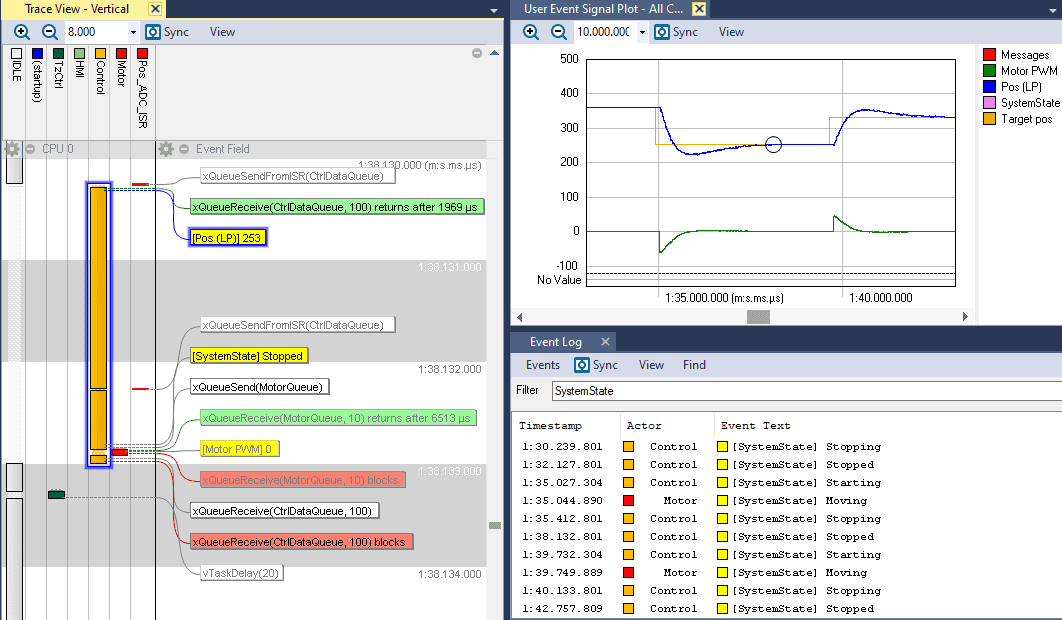
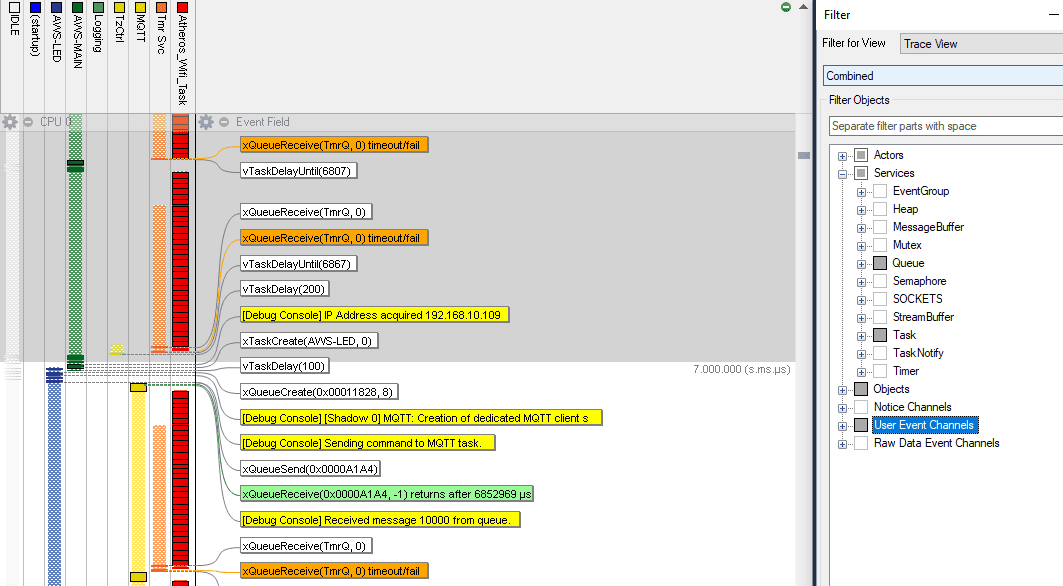
When logging with Tracealyzer, the application log messages are displayed in the trace view as “User Events” together with the thread execution. The log messages makes it easier to understand the thread-level execution trace, and the execution trace reveals the software activity in between your logging points.
Moreover, you can visualize your application log messages in several ways. This simplifies debugging of key algorithms in your embedded application.
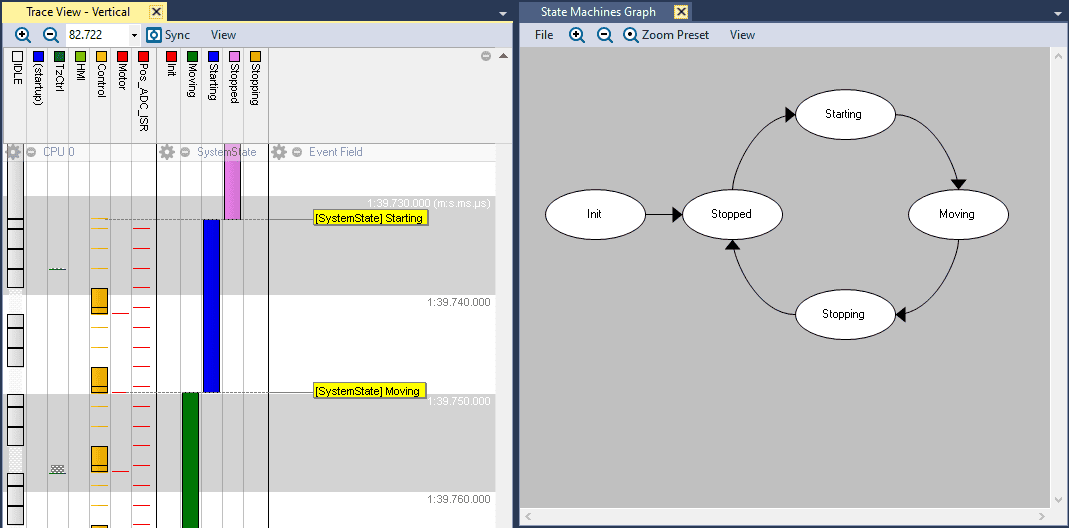
Integer values included in your log messages can plotted over time using the User Event Signal Plot view. This is quite useful for showing inputs, outputs or internal variables in your code. Logged state variables can be displayed both in the trace view and in the State Machines Graph.
Pinpoint Bugs in Visual Overviews
When an error occurs during testing, the bug is not always in the code that failed. For example, if the device runs out of memory, the reason is often a memory leak in a different thread, i.e. some unrelated code is missing to free a temporary memory allocation. Debugging with breakpoints or printf logging is not effective in such issues.
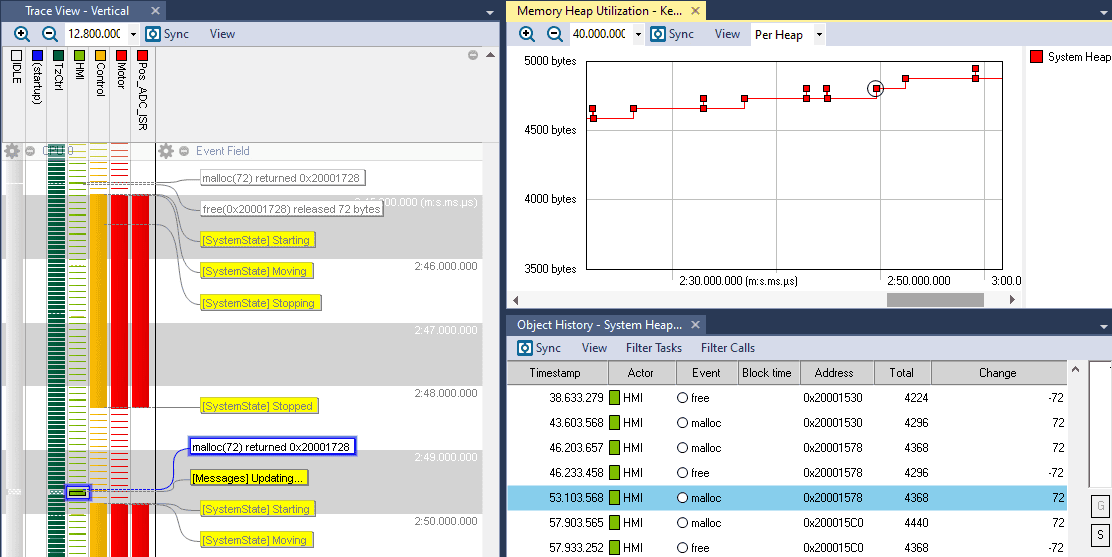
Tracealyzer provides many visual overviews that provides a holistic view of the runtime system showing key runtime metrics and their variations over time, for example CPU load, execution times, heap memory allocation and stack usage. When issues are found, you can drill down in the detailed trace view to learn more and often find the explanation quickly.
In cases where the system hangs or have timeout errors, the cause can be multi-threading issues such as deadlock or priority inversions. Such issues can be efficiently diagnosed with Tracealyzer. Such issues can be very difficult to debug with traditional methods when you understand the problem with Tracealyzer they can be easy to fix. In the example below, a deadlock (circular waiting) occurs because the threads are locking two shared resources at the same time and in different order. Such issues can be found in the Actor Instance Graph (wait time per thread execution. Simply double-click on the abnormal data points to see the details in the trace view. The risk for deadlocks can also be seen in the Communication Flow graph that summarizes the traced interactions between the threads.
Real Time Streaming
Tracealyzer supports real-time trace streaming where the data is stored on the host computer and displayed in live animated views over extended periods of time.
This doesn’t halt the target device, which is invaluable when traditional breakpoint debugging can’t be used. For example, in control systems and communication protocols where a connected device needs periodic communication. Halting on a breakpoint may cause the other device to fail and continued debugging might then give the wrong picture.
The trace data can be streamed in many ways, for example using Segger J-Link or IAR I-Jet debug probes, networks connections, USB or other interfaces you might have in your device.
Many Processors and Development Tools Supported
Percepio Tracealyzer does not require special tracing hardware and can be used with most compilers and embedded processors, from 32-bit microcontrollers to 64-bit multicore SoCs. Preconfigured support is provided for many popular processor cores, including Arm, ESP32 and others. For Zephyr development, Tracealyzer supports all boards in the Zephyr catalog.
For supported RTOSes and Linux, the kernel tracing does not require any manual code instrumentation. You are up and running in 15 minutes.
Experience the Difference
Ready to supercharge your embedded software debugging? Sign up for a free trial and try Tracealyzer on your own code. See firsthand how it accelerates your debugging, helps you optimize software performance and verify your software system in depth. Join over 900 development teams globally who have turned to Tracealyzer to boost their development speed. Supercharge your debugging with Percepio Tracealyzer.