When debugging or profiling your firmware, it is often important to trace Interrupt Service Routines (ISRs) such as timer interrupts or interrupts from communication interfaces. However, using a classic ”printf” call is typically not an option since it may increase the execution time of the ISR by orders of magnitude. The integrated ”exception trace” support in Arm MCUs can be useful in some cases, but offers no way of selecting what ISRs to trace – you get all or nothing. Since some ISRs are very frequent but perhaps not very interesting (e.g. the kernel tick interrupt), hardware-based exception tracing tends to produce huge amounts of irrelevant data, so much that most debug probes can’t handle it.
Percepio Tracealyzer offers another way of doing ISR tracing, allowing you to select what ISRs to trace but without the massive overhead of ”printf” calls. Tracealyzer relies on highly optimized software instrumentation, that can be applied selectively. The resulting data can be displayed in many ways, e.g. on a timeline together with other kinds of software events, or as high-level statistics such as average CPU load and maximum execution time.
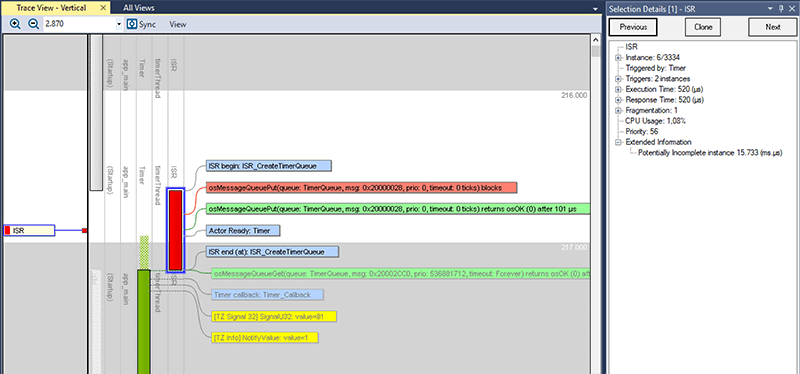
A Keil RTX5 trace in Tracealyzer 4, showing an ISR in red.
For tracing of Keil RTX5 systems, Tracealyzer relies on Keil’s Event Recorder library. Unfortunately, this library does not yet provide any explicit support for tracing of ISRs.
However, here is a neat trick for seeing your ISRs from a Keil RTX5 system in Tracealyzer:
- Add two User Events in each ISR you like to trace, one the entry and another one in the exit of each ISR handler. Give them sensible names, like ”SPI3_IRQn_Entry” and ”SPI3_IRQn_Exit”.
- Record a trace and verify that your User Events from Step #1 show up. It is easy to see in the Filter view (under User Events).
- Locate your Tracealyzer installation directory and find the file \cfg\rtx5-os2-map.xml. Make a backup copy and then open the original file in a text editor.
- In your rtx5-os2-map.xml, locate the <IsrSections> part and add the following definition for each traced ISR, using the event names you specified in step #1:
<IsrSection name="SPI3_IRQn">

<Pattern name="SPI3_IRQn_Entry" irq="True" />

<Pattern name="*" max="20" irq="True" />

<Pattern name="SPI3_IRQn_Exit" irq="True" />

</IsrSection>
Now, restart Tracealyzer and verify that your traced ISRs appear in the vertical trace view, as ”Actors”. Note that your User Events for the ISR entry and exit events are now treated as kernel messages instead. Note that this trick in only needed when using Tracealyzer with Keil RTX5. If using FreeRTOS, SafeRTOS or Micrium µC/OS-III, ISR tracing is explicitly supported using the functions vTraceStoreISRBegin and vTraceStoreISREnd in trcRecorder.h.
The ”max” attribute
In step 4, you may have noticed the ”max” attribute on line 3. This tells Tracealyzer to scan maximum 20 events ahead from the Entry event to find the corresponding Exit event. This is used to limit the size of certain internal buffers and thereby the overall memory consumption of Tracealyzer. The value 20 is probably sufficient in most cases and not excessively large. However, if Tracealyzer does not show your ISRs as expected, you may need to increase this setting.
In case you plan to record really long traces, you may want to optimize the ”max” setting to reduce the memory usage of Tracealyzer. To do this, we need to find the real number of events in between the Entry or Exit events. It may be considerably smaller than 20. You can check the real value in the following way:
- First, we need Tracealyzer to display all events in their native form. The RTX5 instrumentation is pretty detailed and Tracealyzer sometimes groups multiple native RTX5 events into a single label in the Tracealyzer views. To see all events, we need to modify the file metadata.xml (found in the trace folder) in a text editor. Locate for the <definitions> section and add this line:
<definition name="ExtendedTraceInformation" value="true" /> - Now, reload the trace and make sure all events are enabled in the Filter. Zoom in on your traced ISR and count the number of events in between the corresponding Entry and Exit events. Use this as your ”max” value in step #4. However, it may be wise to add some safety margin.
Overhead considerations
Tracing an event is pretty fast – it is typically done in some microsecond, depending on the hardware and compiler optimizations. However, note that Tracealyzer is not aware of this overhead, so the reported timing and CPU usage of your ISRs will be somewhat increased by this. This is typically not noticeable for tasks that execute several milliseconds, but for very short ISRs this can actually be a fair amount of the reported execution time. You can measure the typical overhead by generating two user events in direct sequence and subtracting their timestamps.
Obviously, software-based tracing is no silver bullet. For ISRs that run very frequently, or are highly time-critical, the overhead resulting from software instrumentation can be problematic. In case you need to analyze such ISRs, hardware-based tracing or statistical profiling may be preferable.
See also this FAQ entry about processing overhead.