The Tracealyzer recorder for FreeRTOS, SafeRTOS and Micrium µC/OS can be configured to stream the trace data via any interface you might have available, such as a fast UART. You do this by providing a custom “stream port”, a simple header file named trcStreamingPort.h, that defines what I/O functions the recorder should use. Examples are found in the “streamport” folder in the trace recorder library. Also see this earlier blog post about this topic.
However, the stream port function needs to provide reliable transfer with sufficient throughput. If you have designed your own custom stream port but Tracealyzer reports “Missed Events”, there are several things you can try to improve the performance of your custom stream port.
The potential issues can be divided into three types:
- The recorder runs out of temporary buffer space.
- Your system produces more data than your streaming interface can handle.
- There are random transmission errors, e.g. due to too high bit rate.
Buffer is full
Let’s start with #1. In most cases, the stream port uses an internal RAM buffer in the recorder, where events are written initially and then periodically flushed to the streaming interface in the TzCtrl task. This arrangement serves two purposes: it smooths out the data rate and it avoids calling the stream port function (e.g. a TCP/IP stack) from within the RTOS kernel instrumentation.
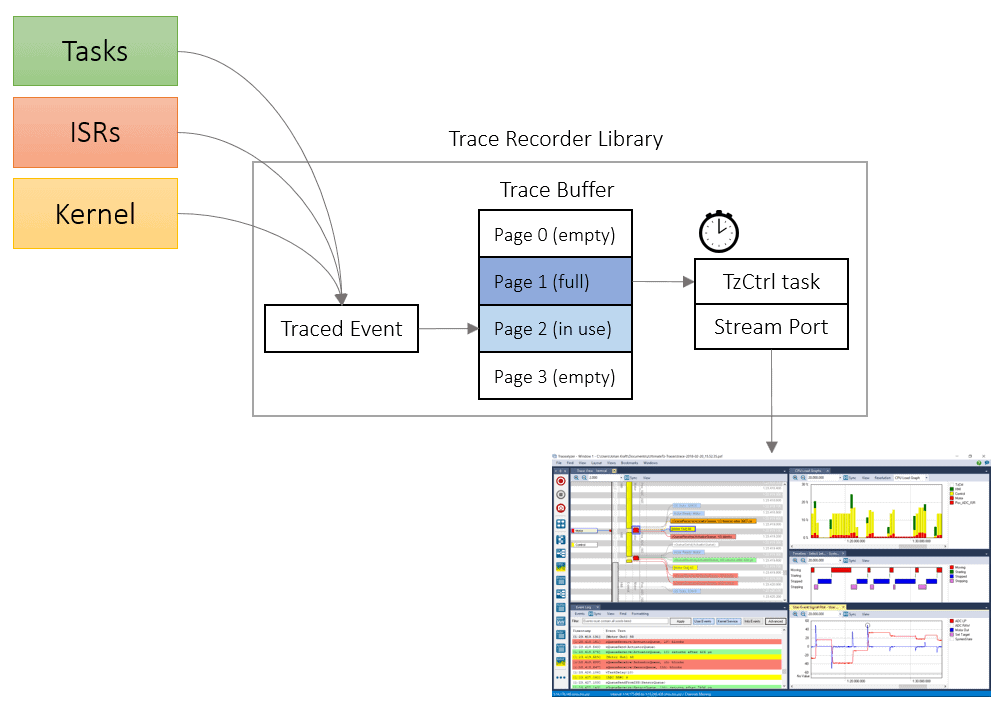
The internal buffer is divided into sections, called pages. The recorder contains a task, TzCtrl, that periodically transfers all buffer pages that have become full, but NOT the active page currently being written to by the recorder. Thus, if you only have the minimum setting of two buffer pages, the TzCtrl task can only transfer one page for every run.
The internal buffering can be configured in trcStreamingConfig.h, using these settings:
TRC_CFG_PAGED_EVENT_BUFFER_PAGE_COUNT: The number of buffer pagesTRC_CFG_PAGED_EVENT_BUFFER_PAGE_SIZE: The size of each buffer page, in bytesTRC_CFG_CTRL_TASK_DELAY: The time between runs of TzCtrl (flushing the full pages)TRC_CFG_CTRL_TASK_PRIORITY: The scheduling priority of TzCtrl.
The default settings are probably not ideal for your system, so the throughput can be improved considerably by tweaking these settings.
If you run out of buffer pages, events will be dropped until a buffer page has been transmitted and is available again. In order to avoid this, you must ensure that the amount of trace data produced between any two runs of TzCtrl does not exceed (PAGE_COUNT-1)*PAGE_SIZE. Note the ‘-1’, since the currently active page is not available for transfer.
An example: let’s say you have allocated two buffer pages of 2500 bytes each and scheduled TzCtrl to run every 10 ms. In this case, the recorder can handle at most 2500 bytes of trace data per 10 ms, which amounts to 250 Kbytes/s. In itself, 250 Kbytes/s is usually enough throughput, but in this configuration the system won’t be able to handle bursts of more than 2500 bytes in any 10 ms interval. This since only 1/2 of the trace buffer pages can be available for transfer. We would therefore recommend using 5 or 10 pages, perhaps with smaller page size, to be able to handle intense bursts of data in a more efficient manner. For example, with 10 pages of 500 bytes each, the recorder can instead handle 4500 bytes every 10 ms since 9/10 of the buffer pages can be available for transfer.
You can also make more efficient use of your streaming interface by running the TzCtrl task more frequently. This way, you reduce the average latency from a buffer page getting full to when TzCtrl starts the transfer. The frequency is controlled by the TRC_CFG_CTRL_TASK_DELAY setting, and decreasing it means that TzCtrl will be checking the buffer for data to send more often. If no buffer page is filled and ready to transfer, the TzCtrl task will quickly return to sleep so this adds very little overhead.
If neither of these optimizations improve the throughput sufficiently, try increasing the total buffer size by increasing PAGE_SIZE and/or PAGE_COUNT. Even if you don’t want to allocate 20 Kbytes of buffer space, try really large values to see if the problem goes away. Once you have a configuration that works, you can reduce the data rate via filtering (see next tip) and then trim the buffer size accordingly.
Note that the recorder uses the internal buffering by default, but if you have a really fast streaming interface you can configure your stream port to disable the internal buffering and instead write directly to the streaming interface. This is done by including the following line in your trcStreamingPort.h:
#define TRC_STREAM_PORT_USE_INTERNAL_BUFFER 0
Filter out unimportant events
If you still experience problems, it might be that you exceed the maximum capacity of your streaming interface. To check this, take a look at the “Live Stream” receiver window.
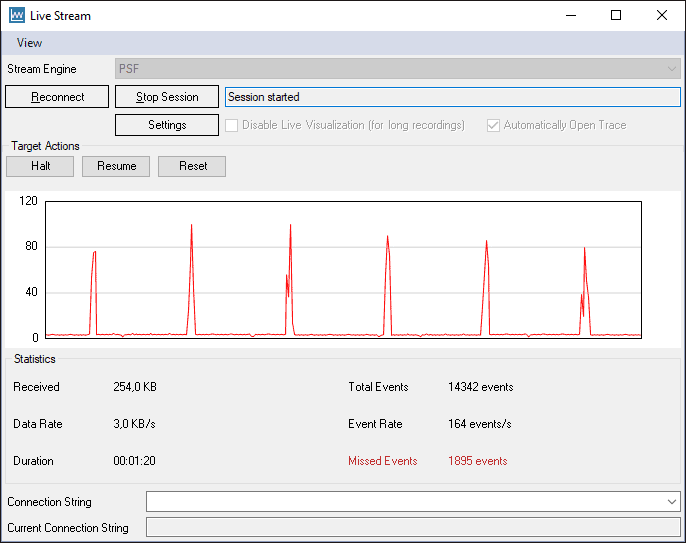
Take a look at the following metrics in the “Statistics” panel.
- Received – total number of bytes received (R).
- Total Events – total number of events received (E).
- Missed Events – total number of missed events (M).
- Duration – the length of the recording session in seconds (T).
To calculate the required capacity for the streaming interface in bytes per second, we need to calculate the average number of bytes per event (R/E). We don’t know the size of the missed events (only their number) but we can assume they are of similar size as the received events, on average. We then calculate the total number of traced events by adding the number of received events and the number of missed events. Them multiply with the average event size and divide by the number of seconds.
(E+M) * (R/E) / T
Example
14 342 events recorded (E) in 254 KB (R), with 1 895 dropped events (D), in 80 seconds (T).
(14 342 + 1 895) * (254000/14 342) / 80 = 3 594 bytes/s
This example system produces less than 4 KB/s on average, so the data loss is probably not related to the streaming interface capacity in this case. But if the average data rate is higher than your streaming interface can handle, you need to reduce the data rate somehow. This can be achieved by filtering out less important events in the recorder, before they enter the internal buffer. Perhaps there are some frequent but not very interesting events that you can live without?
One way is to change the static (compile-time) filters in trcConfig.h, e.g. by disabling TRC_CFG_INCLUDE_READY_EVENTS and/or TRC_CFG_INCLUDE_OSTICK_EVENTS.
A more sophisticated approach is to use dynamic runtime filtering, which allows you to exclude specific tasks or objects using the recorder API functions vTraceSetFilterMask and vTraceSetFilterGroup. They are described in the Tracealyzer user manual, under Recorder API.
It could be a bad cable
Last but not least, it might be that you are getting random transfer errors, e.g. due to a bad cable or too high bit rate. Try to set up a bare bones example, just a loop in your main function that generates a steady stream of data over your streaming interface. Find a suitable tool to receive the data with, like a terminal program, save it to a file and check for any errors in the data. This is quite easy to spot if you send a repeating byte pattern, like a fixed 32-bit word or a counter. If you still see data errors this way, don’t blame us! 🙂
Now it is time to hook up your trusted oscilloscope and take a look at the signal. Are your pulses really square waves? If not, perhaps you are pushing the limits of your interface. Try reducing the baud rate to see if a more stable transmission can be achieved. Lower throughput is much easier to deal with than random data loss, since the former can be compensated with filtering that reduces the data rate. If all else fails, consider changing to another streaming interface, or simply invest in a better debug probe with Tracealyzer support.