When debugging an RTOS-based system, tracing can often give a better understanding of the real-time behavior of your system. Percepio Tracealyzer supports two main types of RTOS tracing, snapshot and streaming, both offering the same powerful visualization although streaming allows for collecting longer traces. The Percepio trace recorder offers several options to allow developers to adjust the tracing setup to fit their target system and their analysis needs.
This gives a brief introduction to the tracing possibilities offered, but you find all details in the User Manual for your Tracealyzer version. See Help menu -> User Manual and navigate to the chapter named “Recording Traces” or “Trace Recorder Library” (typically the second chapter).
Streaming Trace Recording
When using trace streaming, the recorded data is sent continuously from the embedded system to a PC running Tracealyzer. Here, the PC is used as recording media, which allows for storing very long traces.
The tracing logic for streaming is quite simple and has few configuration options, but the data transfer to the PC is very configurable, through a notion of “stream ports” – a set of macros that define how to transfer the trace data. There are predefined stream ports, including SEGGER J-Link, TCP/IP and USB CDC, that works out-of-the-box or with minor adaptations. You may also define your own stream port for any suitable interface your system might have. Since the amount of data produced by RTOS tracing is moderate (typically 20-200 KB/s) many common host-target interfaces can be used, and also device file systems.
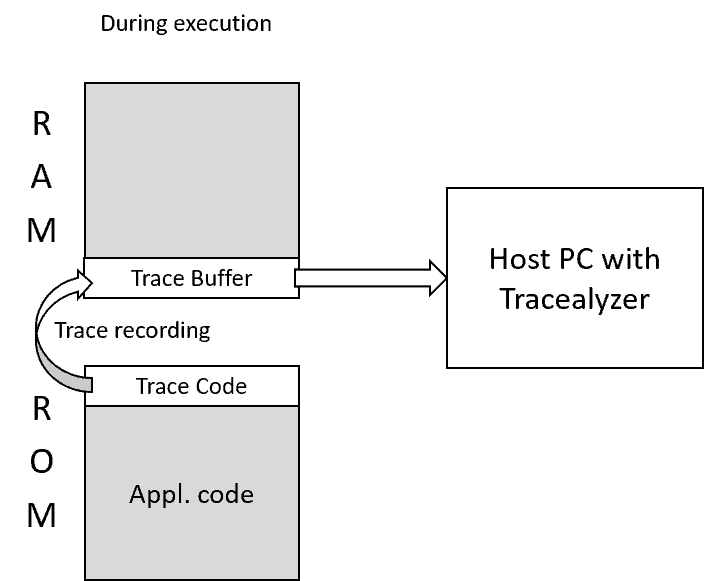
Snapshot Trace Recording
When using snapshot trace recording, the trace data is stored using a target RAM buffer. The name “snapshot” reflects that it is only possible to keep a part of the trace. The benefit of snapshot trace is the simplicity and the possibility to use tracing in deployed devices. Tracealyzer only needs a raw dump of the trace buffer from RAM. This can be produced in any way, e.g. using GDB or a serial port. Tracealyzer has also been integrated with common debug probes and IDEs to automate this process.
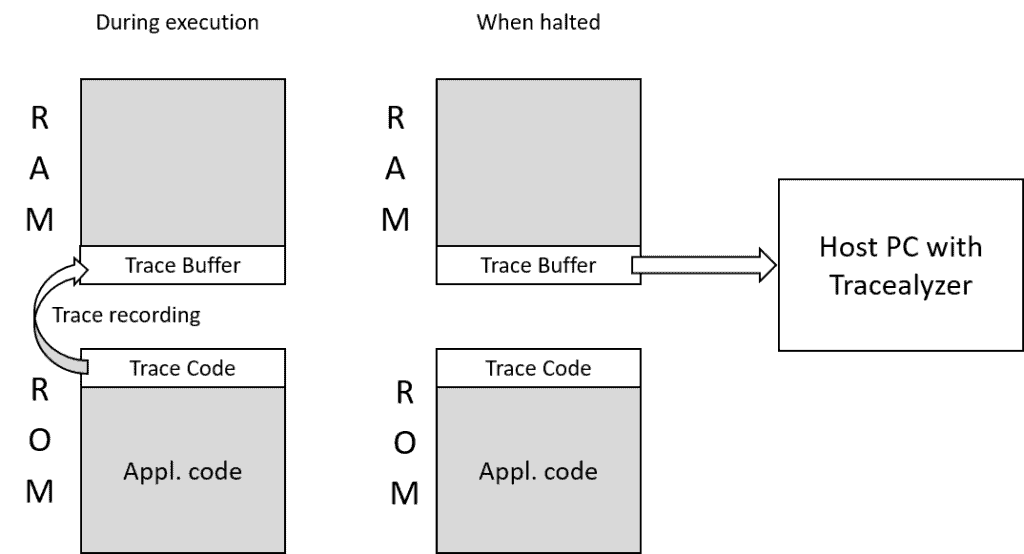
The snapshot recorder can also be managed from the target code, allowing for making trace snapshots programmatically and saving it to a local file system. This requires that the recording is stopped while the trace data is saved.
Since v4.6, snapshots are supported within the default mode (streaming), by selecting the RingBuffer stream port. This is the recommended method for snapshot trace. However, the recorder library also contains a separate legacy solution for snapshot tracing, selected using the setting TRC_CFG_RECORDER_MODE in trcKernelPortConfig.h. However, we recommend using the streaming mode, which is the default setting.
Custom Streaming – Target Side
You create a custom stream port is by providing low-level functions for reading and writing to the interface, and defining the stream port macros in a header file called trcStreamPort.h. There are several examples in the predefined ports that demonstrate how this can be done (see the /streamports folder), and you typically copy one of these and modify accordingly.
The streaming typically requires a temporary RAM buffer (a few KB) to handle spikes in the data rate. The streaming recorder provides such a buffer, active by default. The WRITE_DATA macro is called from the trace control task (TzCtrl), sending one “buffer page” at a time, as they become full.
It is however possible to disable the buffer and write the data directly to the streaming interface. This reduces the RAM usage, but requires a fast streaming interface – much faster than the average data rate of your trace. The interface must be able to transmit 8-20 bytes very quickly, as the WRITE_DATA macro is then called directly when events are registered (e.g. inside the RTOS kernel). To use the direct approach and omit the RAM buffer, add the following definition to trcStreamPortConfig.h:
#define TRC_CFG_STREAM_PORT_USE_INTERNAL_BUFFER 0
Also note that if using the direct approach, the WRITE_DATA macro must not use other traced functions (like RTOS services), since that would cause infinite recursion.
Custom Streaming – Host Side
The trace data can be received directly into Tracealyzer if a predefined stream port is used. In the current version this includes SEGGER J-Link, TCP and UDP (example for lwIP) and USB CDC serial connections. Tracealyzer can receive data directly from TCP/UDP sockets, from COM ports and files.
Target interfaces without explicit support in Tracealyzer can be used in two ways. Option one is to use some PC utility as a proxy/bridge between the target interface and Tracealyzer, e.g., using TCP/IP on the Tracealyzer side. This way, you can use the integrated “Connect to Target System” dialog to start, stop and receive the trace.
The second option is to receive and save the data to a binary file using a PC utility that support your interface. Name the file “something.psf” and open it in Tracealyzer. This requires that you control the tracing outside the Tracealyzer GUI, e.g., by calling xTraceEnable(TRC_START) in the target code. You may also use some PC utility to send the binary “start” and “stop” commands via your custom interface (for details, see prvProcessCommand and prvIsValidCommand).
Examples of Custom Streaming
We have users that have customized the Tracealyzer streaming for various interfaces with good results. Some examples are:
- Serial port, using the USB peripheral setup as a CDC device. Data can then be captured using the PC: s COM interface. We have observed speeds exceeding 600 KB/s using this method.
- Memory card. This requires that you implement the trace control (start/stop) using another interface, or programmatically in your target code. A normal SD-card is capable of recording at 1MB/s. Buffering is recommended due to the write latency.
- I2C, similar to UART. Today, a fast device communicates at 3.4 Mbps, corresponding to about 300 KB/s, more than enough assuming that buffering is used.
As mentioned, typical data rate from RTOS tracing is in the range 20-200 KB/s, and 20 KB/s is essentially means an idle system. Around 100-150 KB/s is probably enough for most systems, but it depends heavily on how the RTOS behaves – how often your tasks execute, and how many RTOS operations they perform.
Filtering
If your system generates more data than your streaming channel can handle, or fills up your snapshot RAM buffer too quickly, the trace recorder library can typically be configured to filter the events to reduce the amount of data. The TraceRecorder library included with Tracealyzer (for FreeRTOS, Zephyr, ThreadX, µC/OS-III, BareMetal and SafeRTOS tracing) provides filtering settings in trcConfig.h. For other Tracealyzer versions which relies on third-party recorder libraries (e.g., VxWorks or Linux), please refer to the documentation of the respective recorder library.
Does your system have any vacant communication peripherals? Can you use them for streaming trace data? If you have any questions, feel free to contact us at support@percepio.com.
/Niclas Lindblom