In the previous post, we introduced Percepio Device Firmware Monitor and showed that a development team can use the DFM to receive trace data and cloud-based alerts when an error such as a timeout, stack overflow or other issue is detected during testing or when a device is deployed in the field. In today’s post, we are going to dive deeper and explain what it takes to set up DFM and how it can be used in a typical IoT application.
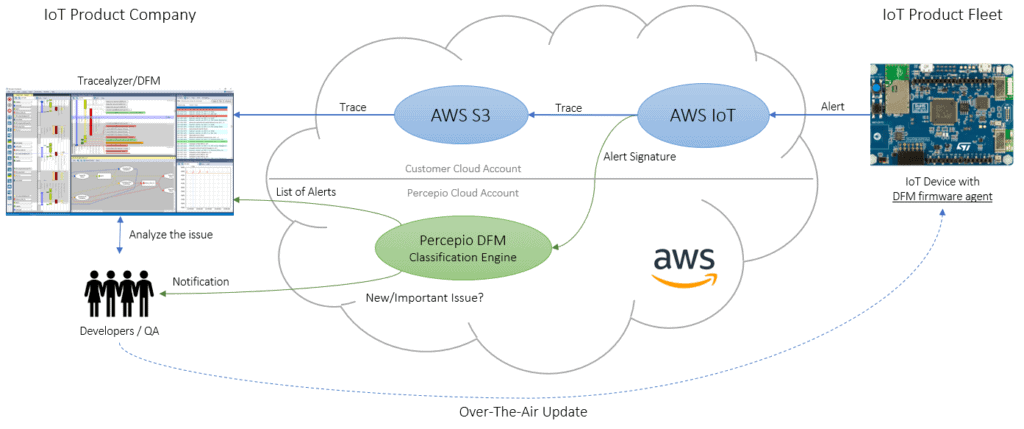
The Device Firmware Monitor System Overview
DFM is made up of four main components:
- The DFM Firmware Agent
- A Cloud service (e.g. AWS)
- Percepio DFM Classification Engine
- Tracealyzer for DFM
A quick overview of the entire system can be seen below
Let’s discuss each of these elements in detail.
First, before a team can leverage the DFM, they need to integrate the DFM Firmware Agent into their embedded software. This is a small piece of code that will gather trace information into a circular buffer so that if an issue occurs, the trace can be transmitted via the cloud service as part of the alert. The DFM Firmware Agent is similar to the trace recorder (in “snapshot mode”) provided with Tracealyzer for FreeRTOS and is equally easy to integrate.
Generating DFM Alerts
Next, we have the actual alerts that need to be setup. The developer needs to add DFM error reporting in their code, typically in existing error handling code such as a hard fault handlers, asserts or if the RTOS detects a stack overflow. When these types of issues are detected, a developer can call the DFM Firmware Agent to upload a DFM alert to the cloud service. An example for an assertion can be seen below:
__assert_failed(const char *file, int line, const char * message)

{

dfm_set_location(file, line);

dfm_add_symptom("Message", message);

dfm_add_symptom("App State", myGlobalAppState);

dfm_alert();

system_recover();

}
In this assert failed function, we generate a DFM alert containing two “symptoms”, the error message and the value of a global state variable, together with the location of the error in the code. The latter can be obtained using commonly available preprocessor definitions like __FILE__ and __LINE__, which are provided as arguments to this function. The dfm_alert function finally uploads this information, together with the trace, to a file in the developer’s private cloud service account. Then we recover the system, via a system reset or some other mechanism. And in case the alert could not be transmitted in the error state, the DFM agent will instead upload it after the system has recovered.
This brings us to the third piece, the cloud service. When the cloud service receives the alert, the trace is stored in the developer’s private cloud account and the next step is triggered by calling the Percepio DFM Classification Engine, a service managed by Percepio. The cloud service provider could be any cloud provider of a team’s choosing, but initial support will be provided through AWS.
Filtering and Classification of Events
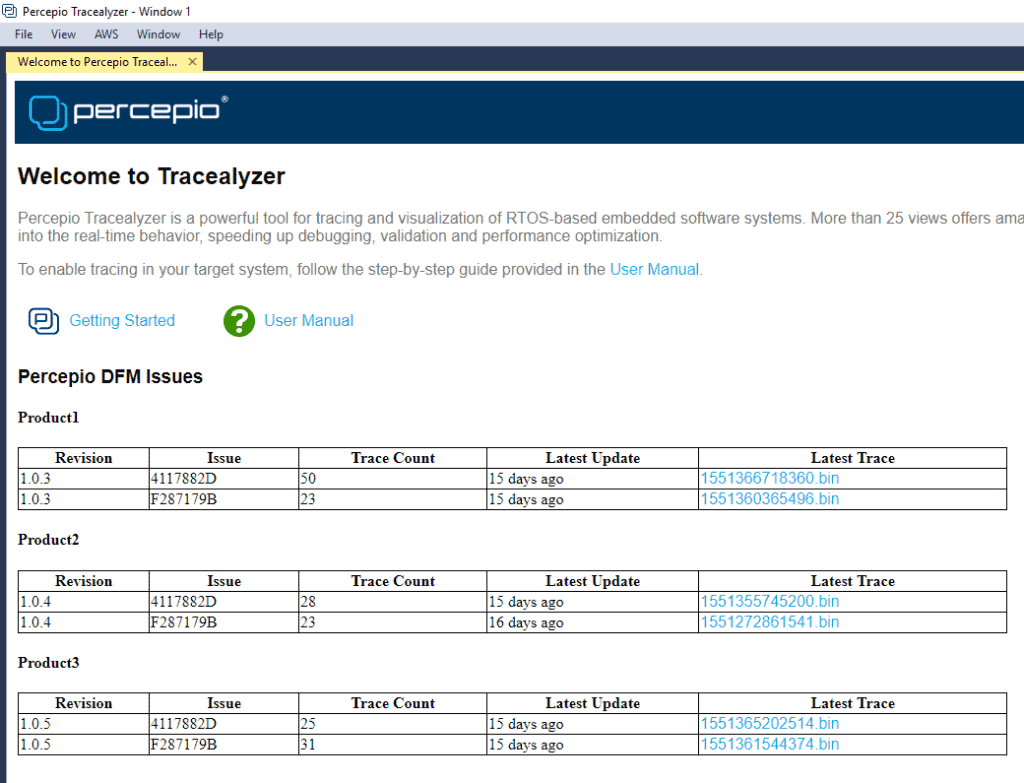
The Percepio DFM Classification Engine is the core of the DFM service and classifies each alert into an issue, i.e. a unique set of symptoms. This is important since a large fleet of devices might generate thousands of alerts, but where most are caused by a small set of underlying issues. You don’t want to have thousands of entries to sift through manually. Instead, the classification engine groups the alerts with identical symptoms and tracks how many times it has occurred. An example classification can look like this:
As you can see, we get several important pieces of information:
- Software version
- An issue ID
- How many times that issue has been reported
- Last received report
- Latest trace received
This provides an easy way to see different issues by version and how many times they are occurring in the field.
Note that you don’t need to provide the actual trace data to the Classification Engine, only anonymous hash codes of the symptoms (like in the “Issue” column above). This can be generated in the developer’s cloud service before calling the Classification Engine. More advanced classification techniques are however possible by also including the trace data.
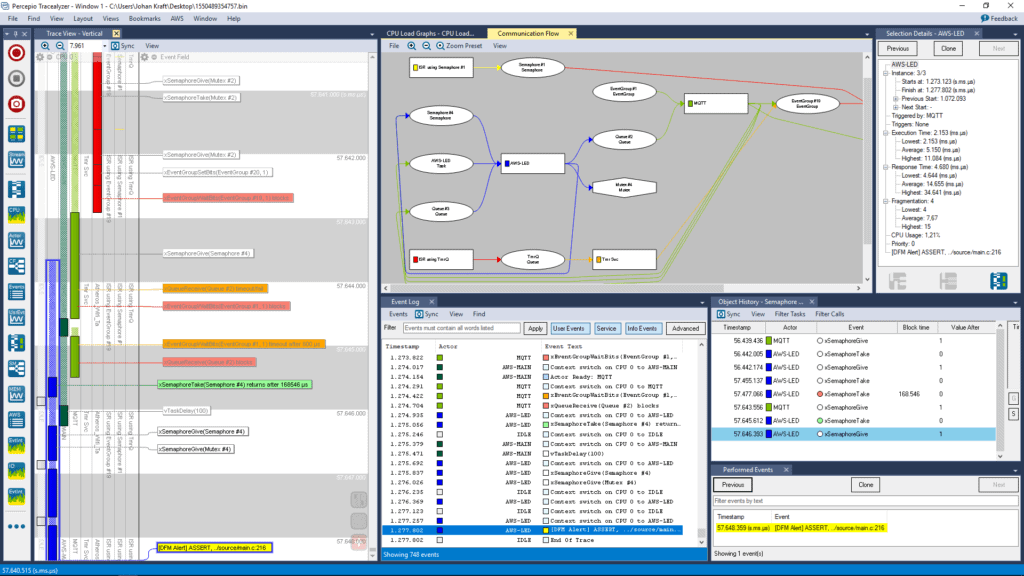
Finally, we have the last part which is analyzing the trace that is uploaded with the issue. At this point, the trace can be downloaded from the cloud service provider and opened in Tracealyzer. In the current prototype for AWS, Tracealyzer can download the trace directly from AWS in a seamless workflow. A developer can then review the trace and work on finding the root cause.
Conclusions
As we have seen, Device Firmware Monitor is an extremely valuable service that is easy for development teams to integrate into their design flow and allows them to gather critical information about problems that may be occurring with their devices in the field. While we can test our devices in a lab environment, it’s extremely useful to be able to record problems that users might have in the field in order to resolve them and, if necessary, provide an over-the-air update to fix the problem immediately.
Testing often just isn’t enough due to the complexity of today’s embedded systems. The ability to retrieve a trace from the field is invaluable!


