The easiest way to stream Tracealyzer traces from an RTOS is often via a SEGGER J-Link debug probe, using the Segger RTT feature. This relies on a RAM buffer that is read by the J-Link probe while the target system is executing. The setup is also described in the Tracealyzer User Manual (see Creating and Loading Traces -> Using TraceRecorder v4.6 or later -> Streaming Trace).
Quick Start
Follow the TraceRecorder guide for your RTOS and apply the following specifics:
- Select the JLink_RTT streamport module.
- If using Zephyr, select the J-Link RTT streaming option in the kconfig settings, or simply add the following options in your prj.conf:
- CONFIG_TRACING=y
- CONFIG_PERCEPIO_TRACERECORDER=y
- CONFIG_PERCEPIO_TRC_START_MODE_START_FROM_HOST=y
- CONFIG_PERCEPIO_TRC_CFG_STREAM_PORT_RTT=y
- For FreeRTOS, ThreadX, bare metal and other RTOSes with TraceRecorder support:
- Make sure to include all .c files in streamports/Jlink_RTT in your build.
- Update your include paths to include streamports/Jlink_RTT/include and streamports/Jlink_RTT/config.
- Ensure no other streamport modules are in the include paths.
- If using Zephyr, select the J-Link RTT streaming option in the kconfig settings, or simply add the following options in your prj.conf:
- As start option for xTraceEnable, it is recommended to use TRC_START_FROM_HOST.
- The first time you run your system with TraceRecorder and RTT streaming, verify that the J-Link is able to auto-detect the RTT control block location in target RAM:
- First, ensure the xTraceEnable() call has been executed and returned TRC_SUCCESS (= 0), e.g. by adding a printf call that shows the xTraceEnable return value. In case of TRC_FAIL (= 1), step through the xTraceEnable function (trcStreamingRecorder.c) to see what check that failed.
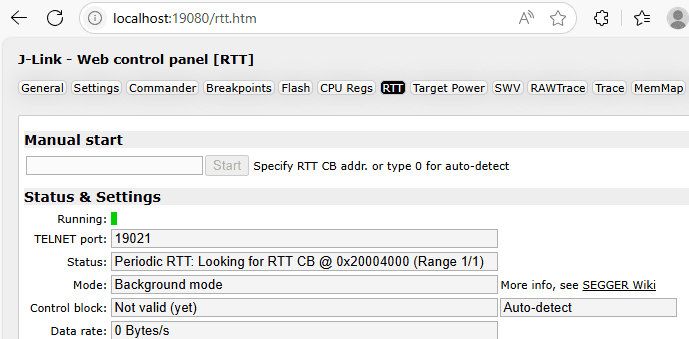
- Then open the J-Link Control Panel at http://localhost:19080 or http://localhost:19081 (there might be two driver instances, one for the IDE/debugger and another for Tracealyzer).
- On the RTT page, check the Status field to verify that the RTT Control Block has been found
- If the status is stuck at “Looking for RTT CB”, please refer to Section 2.1 in the troubleshooting guide below.
- In Tracealyzer, open File -> Settings -> PSF Streaming Settings, set Target Connection to SEGGER RTT.
- Use the default settings:
- RTT Control Block Address: auto-detect (= 0)
- Target RTT Up Buffer Index: 1
- Target RTT Down Buffer Index: 1
- Reset Target on Connect: Not checked
- Target Starts Tracing: Not checked
- Use the default settings:
- In Tracealyzer, select Trace -> Open Live Stream tool.
- With the target system running, click Connect and Start Session. Tracealyzer should now start receiving trace data.
- Check the Statistics panel in the Live Stream window:
- If Total Events remains at zero, refer to section 2 in the troubleshooting guide (below).
- Check for “Missed Events” in the Statistics panel (not displayed if zero). If you have Missed Events, please refer to section 3 in the troubleshooting guide (below).
- To analyze the trace, click Stop Session to finish the recording session.
Troubleshooting guide for Segger RTT
1. General Things to Check
1.1. Have you integrated the trace recorder library properly, including the extra steps needed to for streaming? This is described in the getting started guide for your RTOS, and in the User Manual found in the Help menu (see Creating and Loading Traces).
1.2. Install the latest J-Link driver. The driver that comes with Tracealyzer or your IDE is typically not the very latest version, as SEGGER makes frequent updates. It is important that the driver in your IDE and the driver in Tracealyzer are of the same version, if the tools are used in parallel.
1.3. Make sure Tracealyzer “PSF Streaming Settings” (see File -> Settings) is matching your recorder configuration.
– If using xTraceEnable(TRC_START_AWAIT_HOST) or xTraceEnable(TRC_START_FROM_HOST), make sure that the checkboxes “Target Starts Tracing” and “Reset Target on Connect” are UNCHECKED.
– If using xTraceEnable(TRC_START), make sure that “Target Starts Tracing” is CHECKED.
1.4. In Tracealyzer, check that the J-Link Settings (File -> Settings) matches the debugger settings in your IDE regarding the J-Link speed and protocol (JTAG/SWD).
1.5. Check that your trcStreamPort.h really is the version intended for J-Link streaming (i.e. from the /streamport/JLink_RTT folder). Make sure no other stream port folders are included in your include paths. An easy way to verify this is to add an intentional error in the right version of trcStreamPort.h, building the code and make sure you get the expected error, or simply delete the other stream port folders.
1.6. Check that all .c and .h files in your trace recorder library are of the same version. This may occur if the recorder code has been upgraded but some files were overlooked, e.g. the stream port files or the config files. The recorder might still compile, but is perhaps not working properly.
1.7. Is your system using low-power mode when idle? This needs to be turned off to allow RTT streaming. See https://wiki.segger.com/RTT#Low-power_modes.
2. In case of “no data received”
2.1. If the Live Stream window does not receive any data or reports an error after you selected “Start Recording”, the problem is most likely that the J-Link driver is not able to auto-detect the address of the RTT Control Block (see https://kb.segger.com/RTT#Auto-detection).
To check the status of the RTT auto-detection, first ensure the xTraceEnable() call has been executed and returned TRC_SUCCESS (= 0), e.g. by adding a printf call that shows the xTraceEnable return value. In case of TRC_FAIL (= 1), step through the xTraceEnable function (trcStreamingRecorder.c) to see what check that failed.
Then open the J-Link Control Panel in your web browser by visiting http://localhost:19080 or http://localhost:19081 (there might be two driver instances, one for the IDE/debugger and another for Tracealyzer).
In case the Status reads “Looking for RTT CB @…” it means that the J-Link driver has not been able to auto-detect the location of the RTT control block. In that case, look up the address to the _SEGGER_RTT symbol. This can be done in your IDE by adding “&_SEGGER_RTT” in a watch/expression, or simply add a print statement that outputs the address to a serial console.
Enter this address into the J-Link Control Panel on the RTT page (“Control block adress”) and press “Start”, alternatively in Tracealyzer PSF Streaming Settings. Reconnect. Now it should establish the connection.
This however requires that you specify the exact address of _SEGGER_RTT, which may change in between builds and then needs to be updated.
Other ways to specify the RTT control block address are described at https://kb.segger.com/RTT#Auto-detection.
Another approach to this issue, is to instruct your linker to place the _SEGGER_RTT data in the scanned memory region, where the J-Link driver will find it. You can see the scanned address range in the J-Link Control Panel (“RTT” page, “Status” field). To add a linker section attribute to the RTT control block, use the macro SEGGER_RTT_SECTION. This allows you to specify a memory section where to place the RTT control block (the _SEGGER_RTT symbol). For example, if using a GCC toolchain, you can place the RTT control block in the bss.RAM2 section by adding the following in your SEGGER_RTT_Conf.h:
#define SEGGER_RTT_SECTION ".bss.$RAM2" /* Assuming bss.RAM2 is available */
Note that the section name is specific to your system. Check your linker file to see the available sections. You can use an existing section in the right memory range or otherwise define a new section for this purpose. The control block is not very large, so moving it should typically not be a problem. It does not contain the actual data buffers, only pointers to them.
2.2. Verify the J-Link RTT transfer on its own, without Tracealyzer in the loop.
2.2.1. Close any open Tracealyzer session.
2.2.2. Download the J-Link driver package if not already done, and locate the JLinkRTTLogger tool.
2.2.3. Disable the Tracealyzer recorder in FreeRTOSConfig.h by setting configUSE_TRACE_FACILITY to 0. You can let the recorder calls remain in your code (vTraceEnable etc.) assuming trcRecorder.h is still included. All calls to the recorder are then disabled and don’t generate any code.
2.2.4. Add the following somewhere in your code, e.g. in “main.c” or similar:
#include “SEGGER_RTT.h”
…
SEGGER_RTT_Init();
SEGGER_RTT_WriteString(0, “Hello!”);
2.2.5. Rebuild your project.
2.2.6. Start your target system and ensure that the RTT code has executed (e.g. by placing a breakpoint just after).
2.2.7. Start JLinkRTTLogger and enter the information asked for. The defaults are typically fine, just hit enter to accept them. However, make sure to specify channel 0 and an output path where you have write permissions. The below screenshot shows a successful transfer.
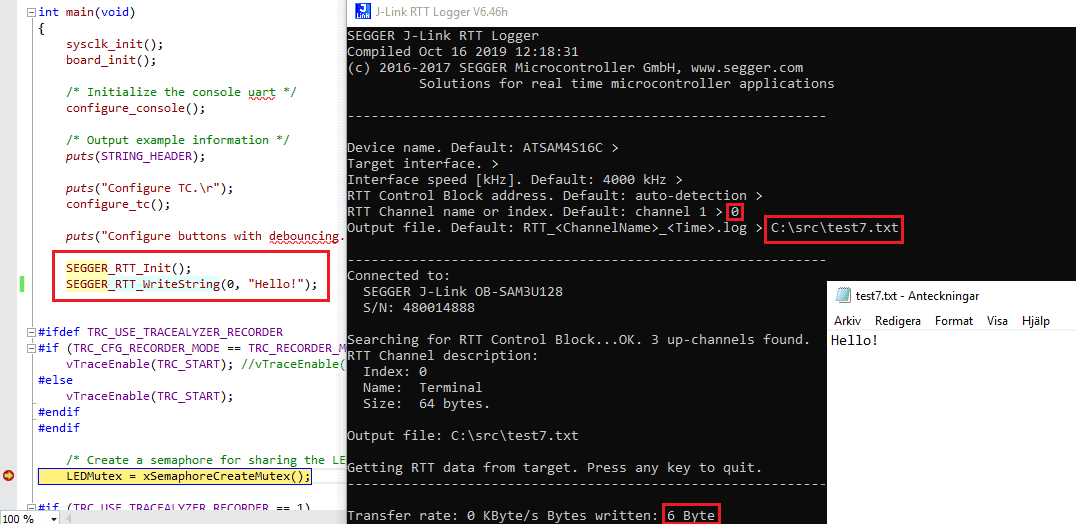
If this doesn’t work, the problem is in the J-Link RTT connection which is provided by SEGGER. However, if you can get data via JLinkRTTLogger like shown above, the problem is most likely related to the integration of the TraceRecorder library. In that case, see the troubleshooting section in the Tracealyzer User Manual or contact Percepio Support.
2.3. If raw data is received (“Received” metric is increasing) but the “Total Events” and “Event Rate” metrics remain at zero, it means Tracealyzer is unable to parse the data stream. This is typically because the initial trace header has not been received. This might occur if the RTT buffer becomes full before the header has been sent. Try increasing the RTT buffer size in trcStreamPortConfig.h (TRC_CFG_STREAM_PORT_RTT_UP_BUFFER_SIZE), or try adding a delay (a break point or busy waiting loop) right after xTraceEnable to give the J-Link more time initialize the transfer.
3. In case of “Missed Events”
In some situations, the tracing may generate data faster than the J-Link is able to read, which causes the RTT buffer to become full. In that case, the default behavior is to discard all new events until there is room in the RTT buffer again. Such “Missed Events” are however reported by Tracealyzer in the “Live Stream” window. Moreover, red areas appear in the live views showing where data is missing. An example is shown below.

The RTT buffer is located in the target system RAM and is polled frequently by the J-Link debug probe. The default size is 5000 bytes, which is typically more than enough, at least if using a stand-alone J-Link and high interface speed.
If you see Missed Events when using J-Link streaming, check the following:
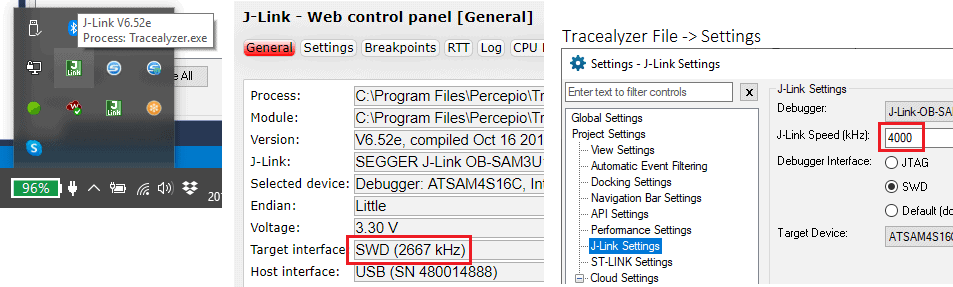
3.1. Open the J-Link Control Panel while the Tracealyzer is receiving data, like in the below screenshot. Make sure to select the one with “Process: Tracealyzer.exe”. Check that the reported “Target interface” speed and make sure it is matching the “J-Link Speed” setting in the Tracealyzer J-Link Settings.
These may differ for at least two reasons:
Reason 1: If specifying a higher speed than what is supported by the J-Link debugger, the driver uses the highest supported speed (in the above example, 2667 Khz instead of 4000 Khz). In such cases, there is no point in trying to increase the J-Link Speed, unless you get a faster J-Link probe. The above example is using a “J-Link Onboard” interface, which are a lot slower than the stand-alone J-Link models.
Reason 2: Under certain circumstances, the J-Link driver seems to ignore the “J-Link Speed” setting in Tracealyzer and instead uses a default value of 200 Khz, which is likely to cause poor throughput and thereby missed events. To avoid this issue, make sure to set the “Debugger Interface” setting to SWD or JTAG instead of using the “Default (don’t change)” setting. If also using other tools, like an IDE debugger, make sure this setting (JTAG/SWD) matches the corresponding setting in your IDE.
3.2. If the J-Link Control Panel reports a Target Interface speed matching the Tracealyzer “J-Link Speed” setting (see 3.1), you may increase the “J-Link Speed” setting for better throughput. The default is 4000 KHz but much higher speeds are supported if using a stand-alone J-Link unit. See “max. target interface speed” in the Segger J-Link Model Overview.
3.3. Increase the RTT buffer size (TRC_CFG_STREAM_PORT_RTT_UP_BUFFER_SIZE in trcStreamPortConfig.h).
3.4. Reduce the amount of data produced, e.g., using the settings in trcConfig.h or reducing tracing calls from your application code such as user events and ISR tracing. Consider using the new type of “compact” user events (introduced in v4.7) to reduce the size of user events, i.e. xTracePrintCompactF() instead of xTracePrintF(). See the API documentation in trcPrint.h.
3.5. Consider upgrading to a faster J-Link debug probe. The onboard J-Link debuggers found on many development boards can only manage 100-150 KB/s at best (if using a large RTT buffer) while a stand-alone J-Link is several times faster. See “max. target interface speed” in the Segger J-Link Model Overview.
Note: If you don’t see any Missed Event, you can try reducing the RTT buffer size. This will reduce RAM usage.
4. In case your system runs slower
If you experience that your system runs noticeably slower when using Tracealyzer with J-Link RTT trace streaming, the most important factors are:
4.1. Using blocking RTT mode?
Make sure the TRC_CFG_RTT_MODE in trcStreamingPort.h is set to non-blocking mode (SEGGER_RTT_MODE_NO_BLOCK_SKIP). This is the default. The other option, blocking mode, can be useful if you don’t have enough RAM to increase the RTT buffer size, but this may result in occasional blocking of several milliseconds. Non-blocking mode is therefore to prefer in most cases, as Missed Events are clearly visible in Tracealyzer while blocking is much harder to detect.
4.2. Compiler Optimizations?
The tracing recorder library becomes considerably more efficient if compiler optimizations are enabled. If not using compiler optimizations, consider using at least basic optimizations (-O1) when tracing your system. Or enable compiler optimizations only for the TraceRecorder files. Most IDEs typically allow for using individual settings for groups of source files. Thus, you can skip optimizations on your application code (e.g. to facilitate debugging) but still apply full optimizations on the TraceRecorder code. You may also want to apply compiler optimizations to your RTOS kernel, as some of the tracing code is macros executing within the RTOS kernel code.
In case of other issues or questions, feel free to contact support@percepio.com.