Mohammed Billoo, founder of MAB Labs, provides custom embedded Linux solutions for a multitude of hardware platforms. In a series of posts over the coming weeks, he will walk us through the new Linux support in Tracealyzer v4.4, using a real-world project as an example.
 In the previous blog post we discussed how we can use LTTng to instrument userspace applications and view the trace data in Tracealyzer for evaluation purposes. In this post, we’re going to understand how the combination of LTTng and Tracealyzer can immediately shine light on how compiler options can impact performance; this traditionally has been an invasive and relatively difficult task. The method discussed can come in handy whenever we are evaluating the performance of multiple candidate implementations of a particular feature.
In this blog post, we’re going to see how the floating-point compiler options can affect the performance of even the most innocuous calculations: a sine function. From this experiment, we can understand how these options can affect the performance of userspace applications that are conducting more complicated calculations.
The following is the snippet of code that will form the basis of this experiment:
#include <math.h>
#include <lttng/tracef.h>int main(int argc, char *argv[])
{
    int x;
    float sample_freq = 1000;
    float freq = 100;
    float sample;
    float t;

    for (t = 0; t < 1000; t++)
    {
        sample = sin((2*M_PI*freq*t)/sample_freq);
        tracef("%f", sample);
    }
    return 0;
}
In the above snippet we are calculating 1000 points of a sine wave at a frequency of 100 Hz, sampled at 1 kHz.
The following is the Makefile that we used to build the above code snippet, which is straightforward:
.PHONY: all

all: hello

sine_test: sine_test.o
${CC} -o sine_test sine_test.o -llttng-ust -ldl -lm

sine_test.o: sine_test.c
${CC} -c sine_test.c
We begin an LTTng session, execute the compiled binary on the command line, and terminate the session (which we’ve demonstrated how to do in the previous post). We then transfer the trace to our PC, open it in Tracealyzer, configure the User Event interpretation and see the following in the User Event Signal Plot:
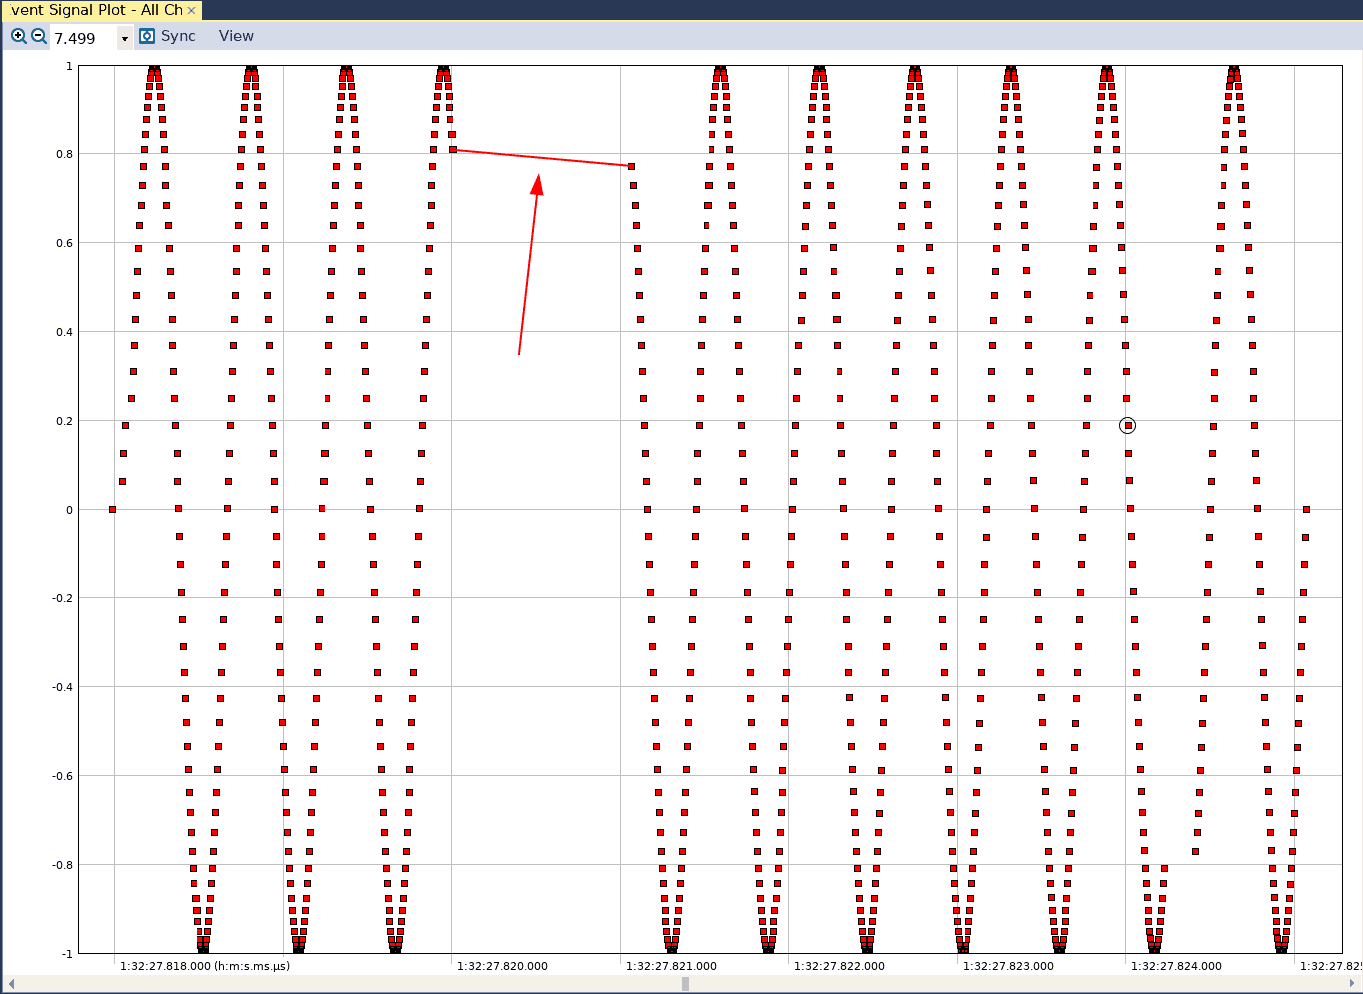
We notice that there is a discontinuity in our sine wave. If we were to add a printf call to our code snippet that prints each sample to a file and then graph the contents of the file, we would see the following:
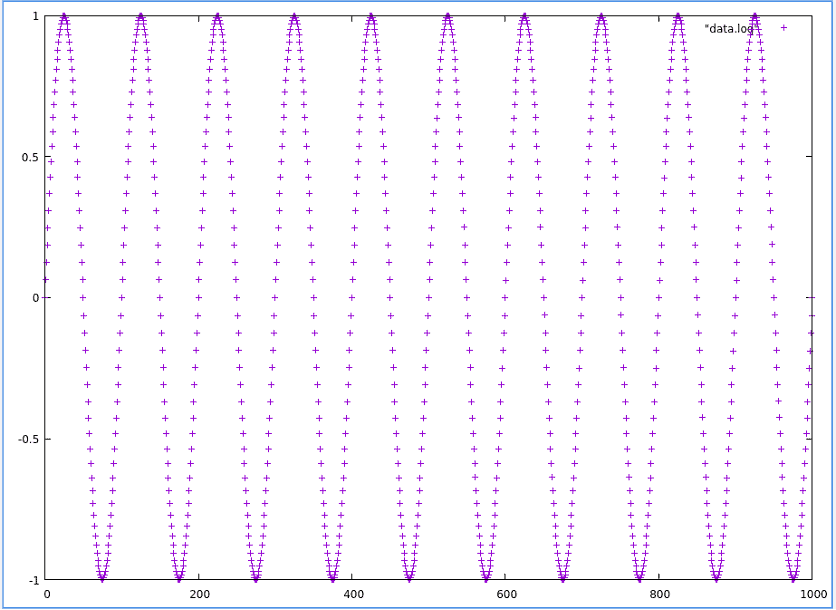
Here, we see a regular sine wave with no sign of any discontinuity. The reason is because when we’re printing the values to a file there is no concept of time. We’re simply outputting the calculated values against the sample count. However, when outputting the calculated values to a trace file, the system time is included with each trace value.
Now, let’s update the Makefile to add a compiler option and see the result (we’re going to discuss these options in some detail towards the end):
.PHONY: all

all: hello

sine_test: sine_test.o
${CC} -o sine_test sine_test.o -llttng-ust -ldl -lm

sine_test.o: sine_test.c -mfloat-abi=hard
If we capture another trace again, we see the following result in Tracealyzer’s User Event Signal Plot:
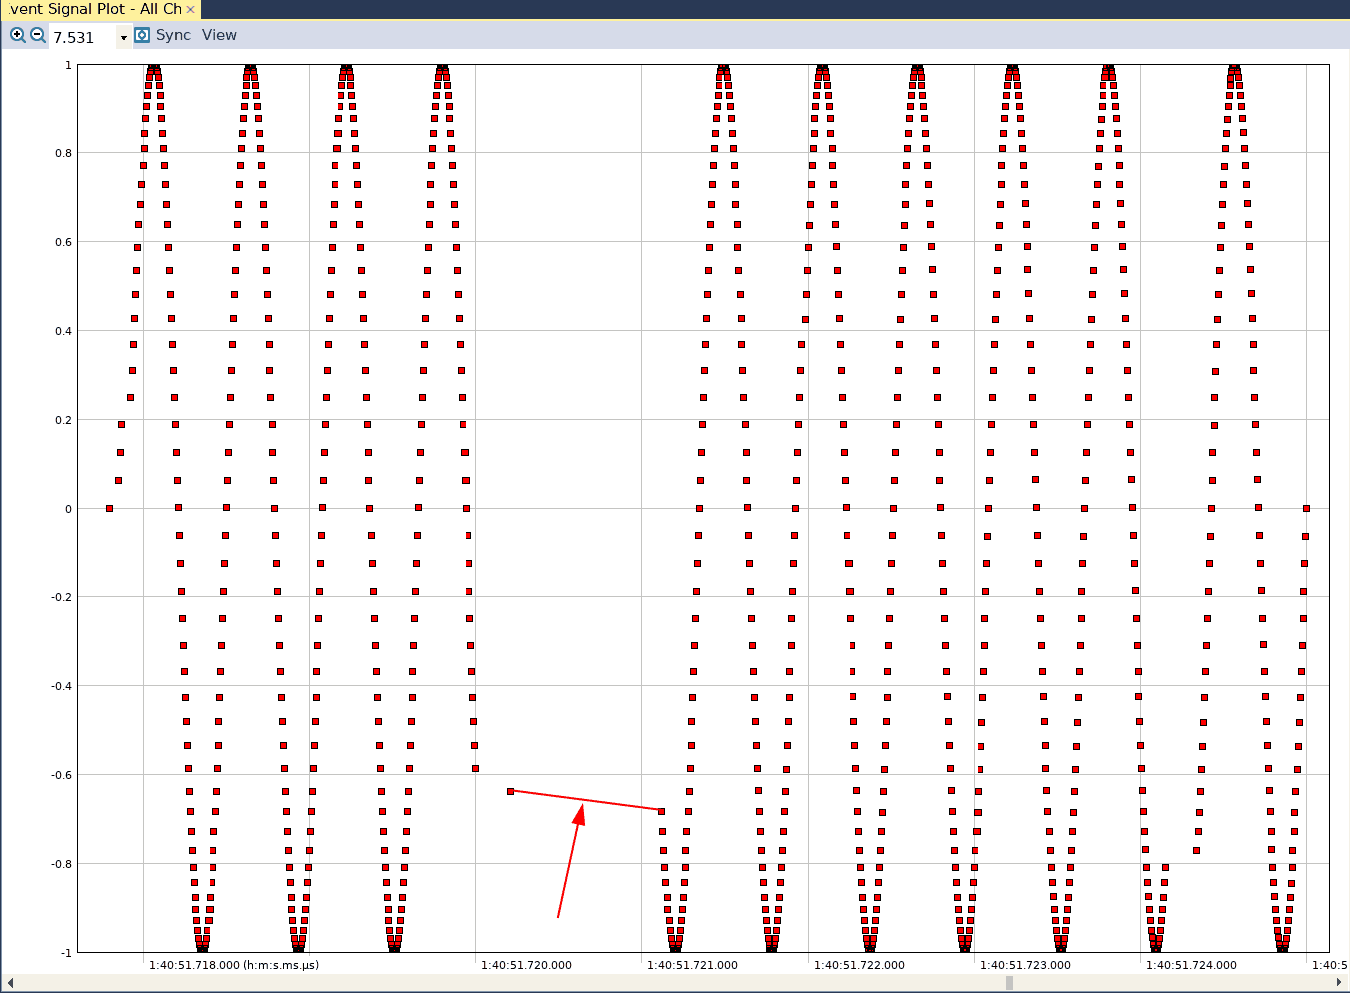
Again, we see the discontinuity. Let’s update the Makefile to add another compiler option:
.PHONY: all

all: hello

sine_test: sine_test.o
${CC} -o sine_test sine_test.o -llttng-ust -ldl -lm

sine_test.o: sine_test.c -mfloat-abi=hard -mfpu=neon
The User Event Signal plot from this trace, captured with the fpu option enabled, will look like this in Tracealyzer:
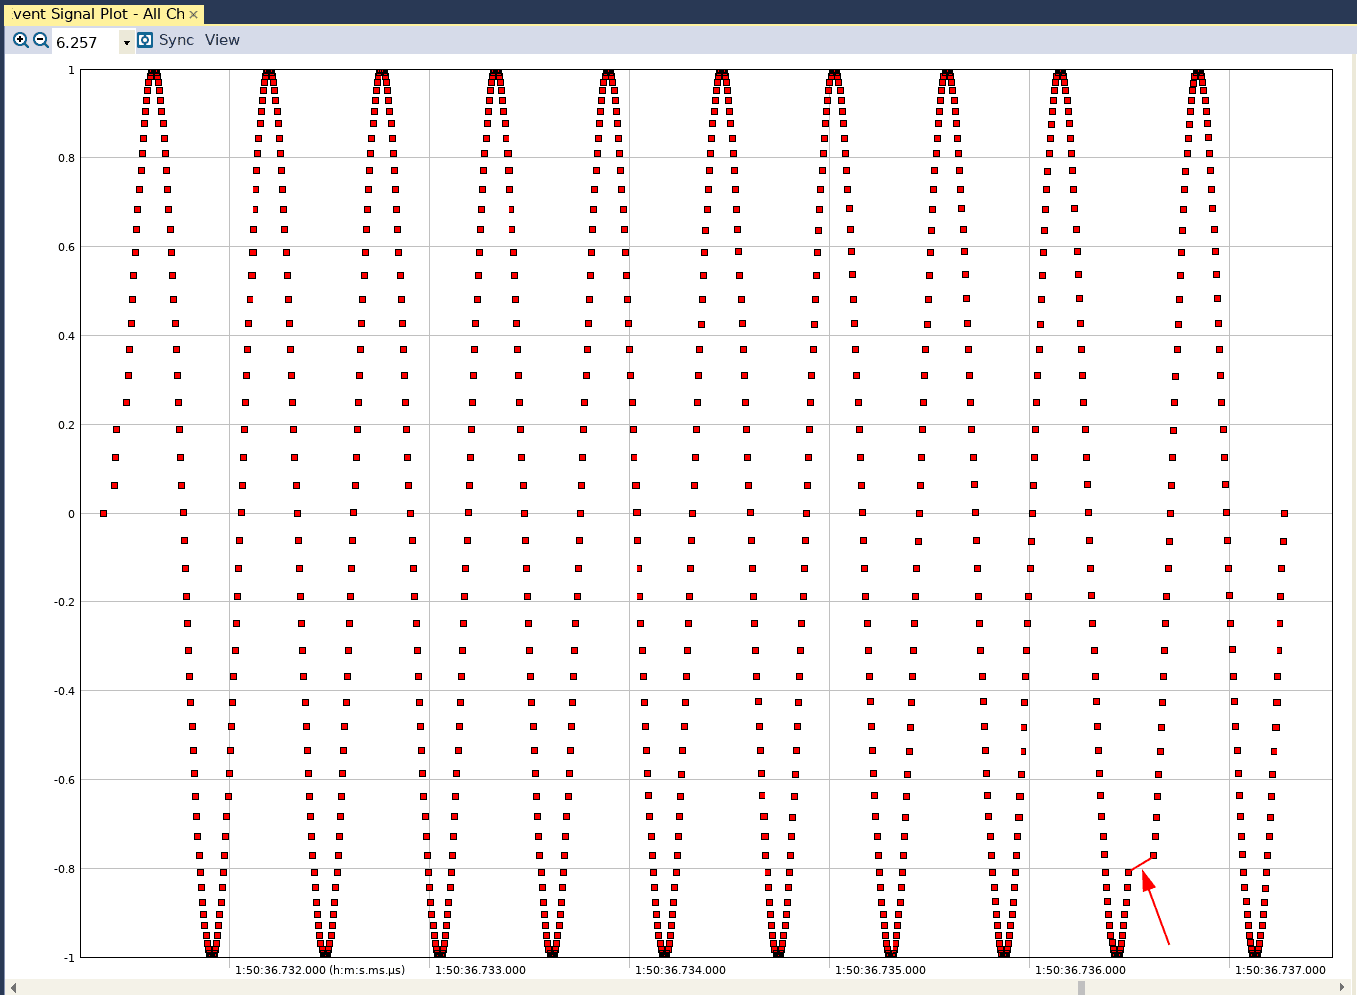
While there is still a discontinuity in the resulting waveform, the time gap has been reduced significantly (recall that the time between two points on this graph is a real time value).
Emulates floating-point with integer instructions
Let’s discuss the compiler options that were added in the Makefile in the context of floating-point operations and why there was an impact on performance. Remember, the architecture of a standard CPU (such as an ARM processor) is designed to efficiently perform integer operations. The architecture of a CPU is not designed to perform floating-point operations efficiently. Then, what happens when we have code that performs floating-point operations?
In the case of our first Makefile, which didn’t have any of the additional options, the compiler converted the floating-point instructions that compute the sine values into a series of integer-based instructions. Of course, this will result in a substantially larger number of instructions for the CPU to execute. Thus, there is a greater opportunity for another task in the system to preempt the sine wave computations.
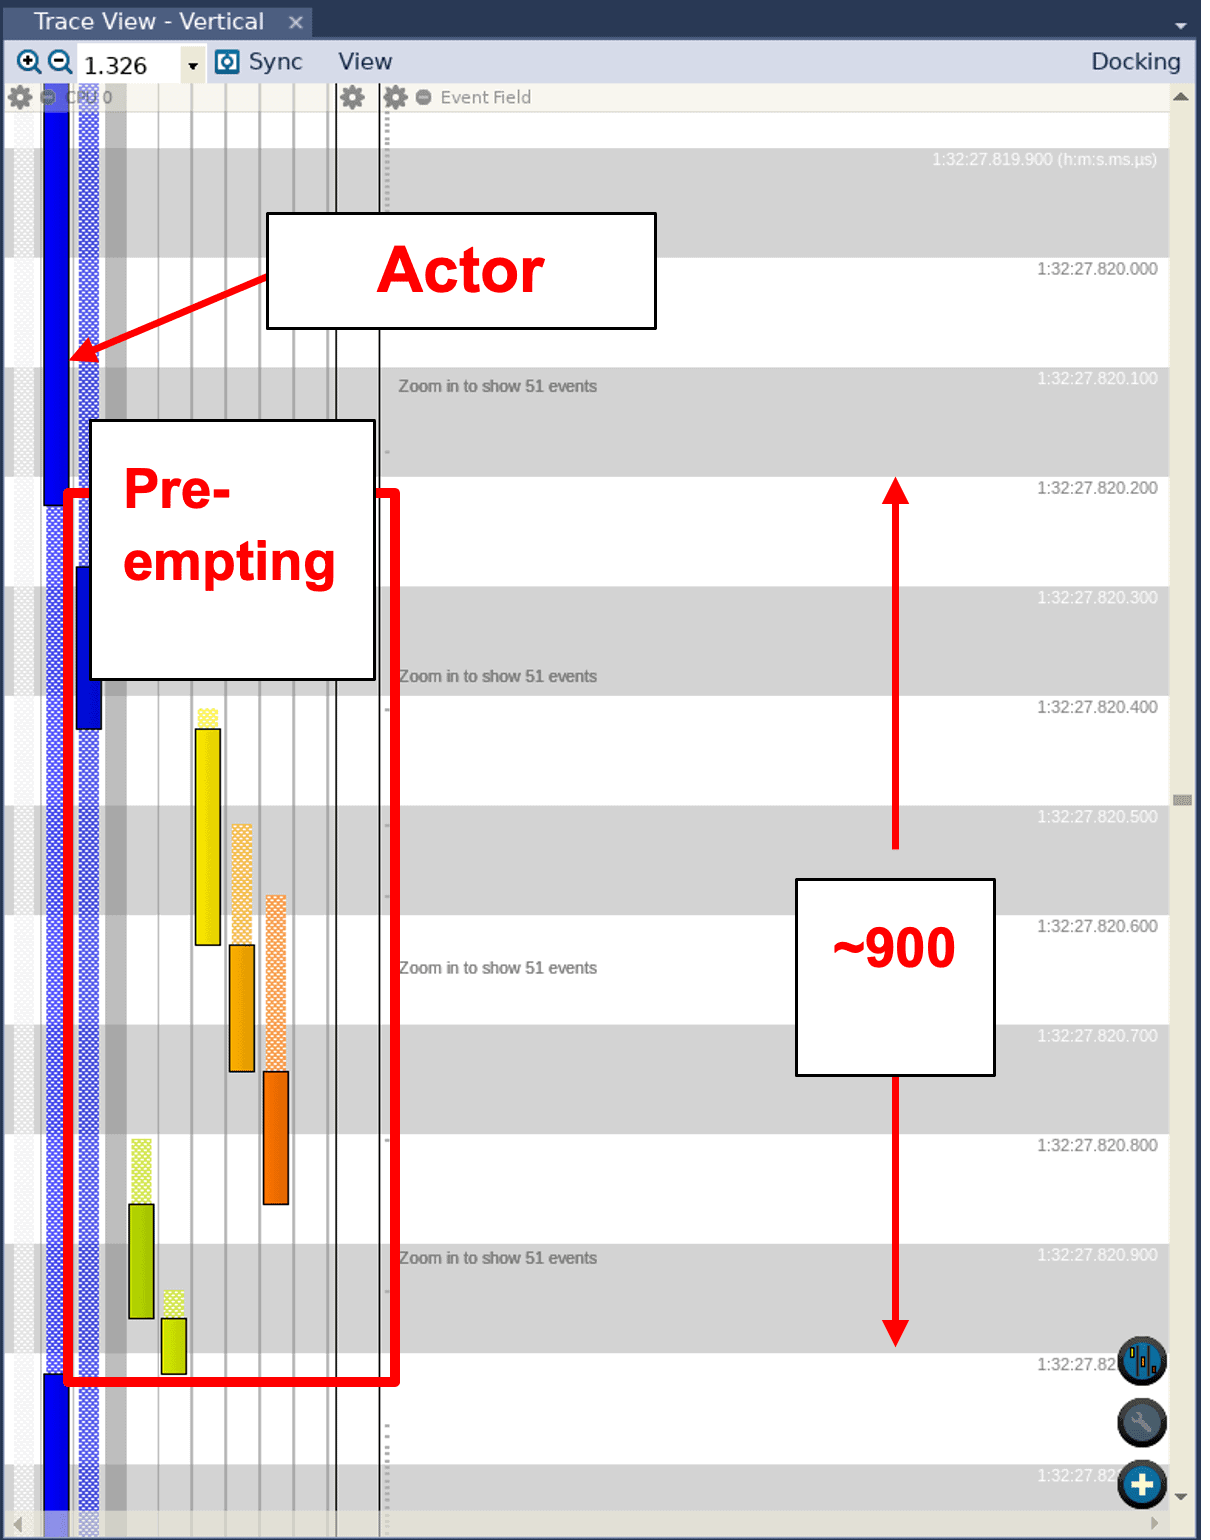
To confirm that this is actually what is happening, let us look at the Trace View in Tracealyzer. We can see that the process responsible for the sine wave calculations does get preempted by other processes. We can also see that this particular process at one time is suspended for 900 microseconds:
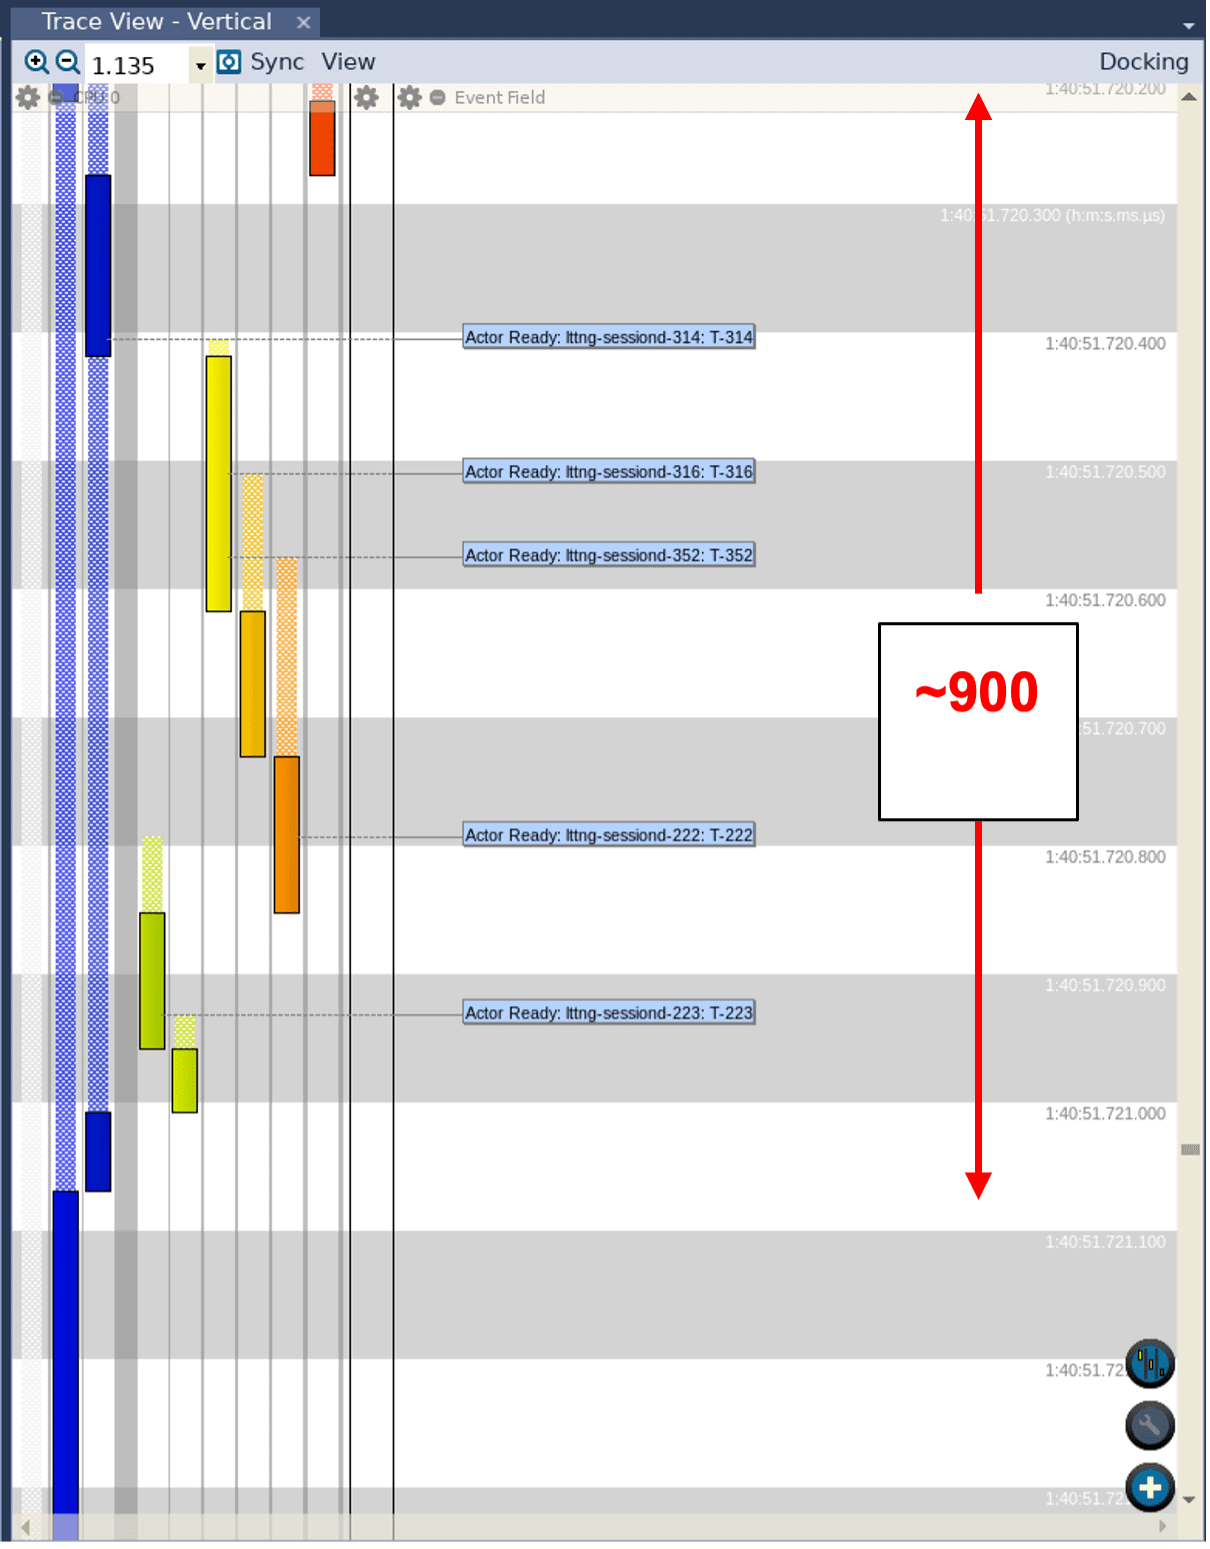
When we specified the -mfloat-abi=hard option in the second Makefile, we instructed the compiler to use a set of instructions that are designed specifically for floating-point operations. However, that didn’t produce any real difference in the outcome; we still saw a similar discontinuity. As a matter of fact, looking at the Trace View of the second trace reveals that the sine wave process was suspended for the same amount of time—900 ms:
Why was that? Well, within this set of floating-point instructions there are specific extensions which enable a separate, heavily optimized floating-point unit (FPU) on the processor itself. However, if we don’t specify the fpu option to the compiler, it doesn’t use these extensions which means the floating-point instructions will still be emulated using the standard integer instructions.
Adding the -mfpu=neon option, as we did in the third run, instructs the compiler to enable a specific set of extensions for this particular FPU (NEON). And with most of the floating-point calculations running on a separate coprocessor, there was little opportunity left for other processes to preempt the sine wave generation—resulting in the much smaller discontinuity we saw in this User Event Signal Plot.
Another way: Custom intervals
But wait, there’s more: we can also visualize the amount of time each sine calculation takes in Tracealyzer by using Custom Intervals. To do this, we take out the invocation of tracef with the computed sine values and insert tracing of “Start” and “Stop” user events (which is similar to what was done in a previous blog post):
for (t = 0; t < 1000; t++)
{
    tracef("Start”);
    sample = sin((2*M_PI*freq*t)/sample_freq);
    tracef("Stop”);
}
We compile and run the application with the above changes, without using the float_abi=hard compiler option, and generate trace data. We can then view the trace data in Tracealyzer, configure a custom interval, open the Interval Timeline view, and see the following (trace view to the left, intervals to the right):
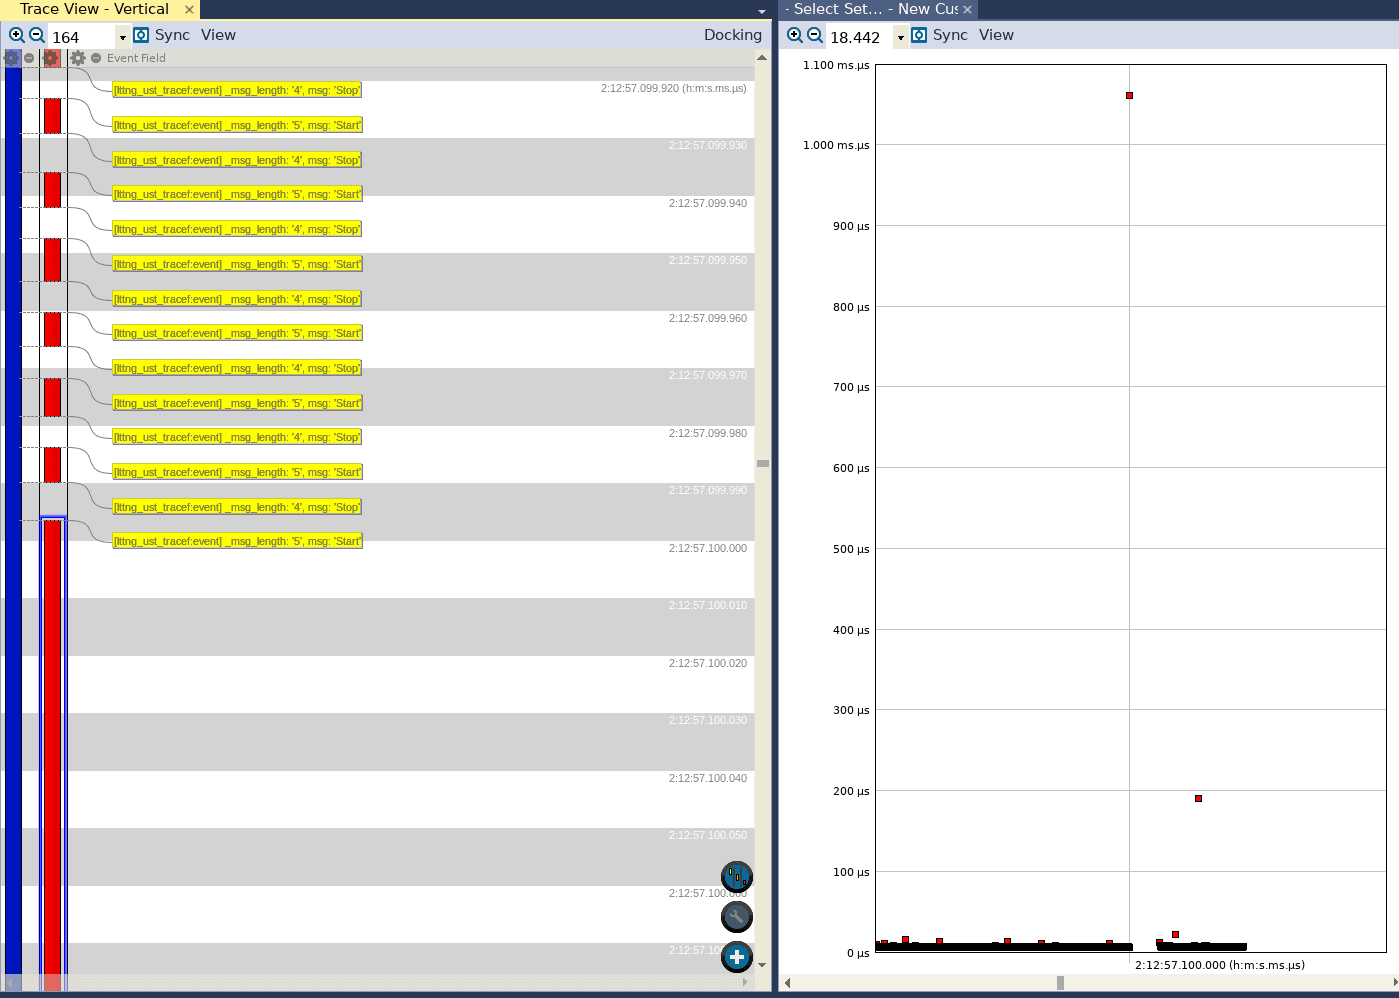
We can see that while for the most part the execution of the function takes somewhere on the order of tens of microseconds, there are a few outliers. We can see that in one case, the function took approximately 200 microseconds to execute, and in another case it took approximately 1.05 milliseconds!
If we do the same after adding the hard ABI option (but not the NEON extensions), we can see the following in the Interval Timeline view:
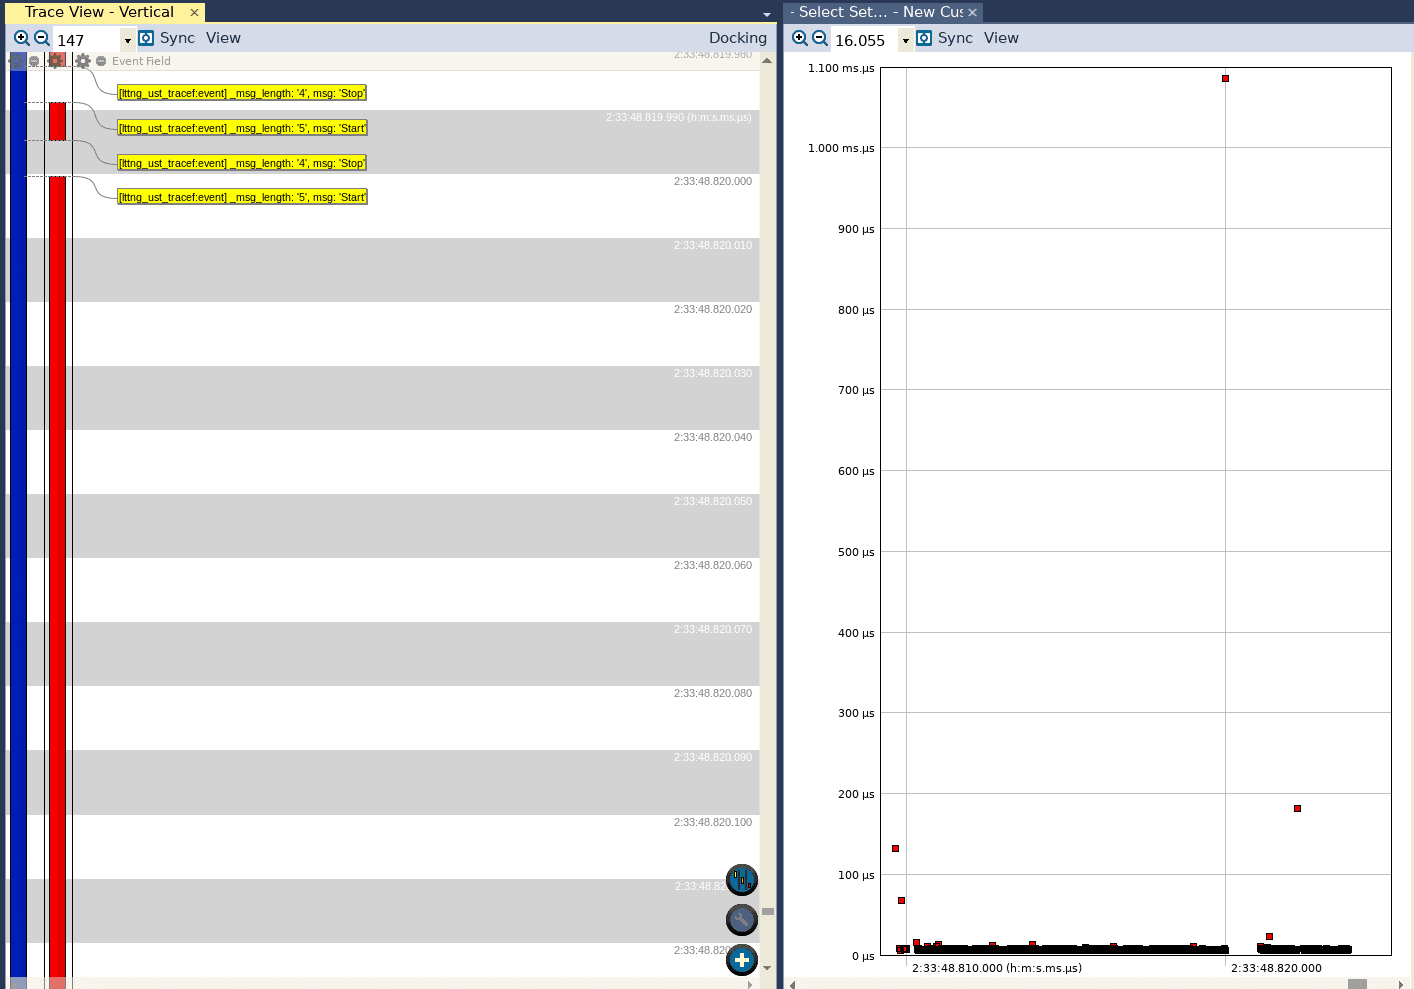
Again, we see similar behavior as we did when using the soft ABI. While most of the executions took on the order of tens of microseconds, there are a few outliers in the range 100—200 microseconds. We also see an invocation that almost took 1.1 millisecond!
Finally, if we open a trace collected when the application was compiled to use both the hard ABI and the NEON extensions, we see the following:
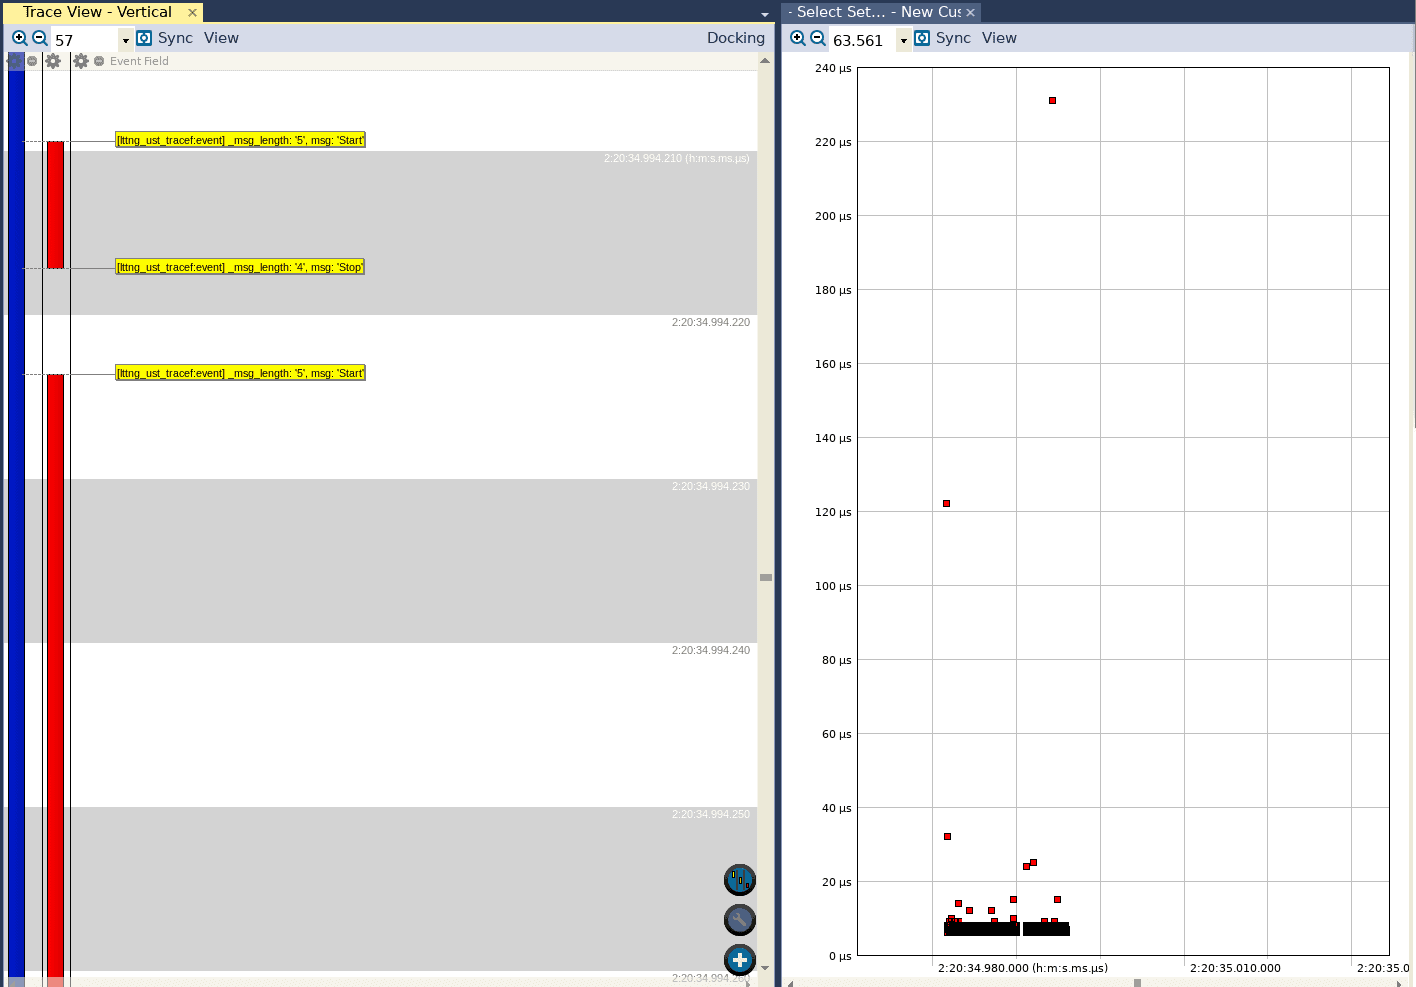
Although there are still a few outliers, we can see that the longest execution time now is a little less than 240 microseconds. This reaffirms the observation made earlier that adding the NEON extensions reduces the worst delay between calculation points considerably.
Conclusion
In summary, we were able to leverage the LTTng library and Tracealyzer to quickly understand the impact of certain compiler options on the performance of userspace applications that perform floating-point calculations. Usually, this sort of analysis is done after the fact, when the application is completed but the observed performance is deemed unacceptable, and it takes a lot more time. By using Tracealyzer during development to verify software timing, we managed to avoid that situation.
Mohammed Billoo, MAB Labs
This is the fifth in our series of articles about using Tracealyzer to capture and analyze visual trace diagnostics for embedded Linux systems.