Using Tracealyzer with VS Code
To analyze your embedded software system with Percepio Tracealyzer, you need to add a supported tracing library in your build. Most supported RTOS integrations use Percepio’s TraceRecorder library.
Start by following the general guide for your RTOS at https://percepio.com/gettingstarted.
Trace data is transferred from the TraceRecorder library to your host system either as snapshots on demand, or with continuous streaming. This guide describes how to capture snapshot traces. For trace streaming, please see the other getting started guides or the Tracealyzer User Manual in see application’s Help menu.
TraceExporter VS Code Extension
The easiest and recommended way to save snapshots is to use the TraceExporter for VS Code extension.

Manual GDB dumps
Another method is to do a manual memory dump using gdb. When in a debug session and halted, run the following command in the Debug Console:
-exec dump binary value trace.bin *RecorderDataPtr
This command saves the data from the RingBuffer module to trace.bin. Open this file in Tracealyzer (File -> Open -> Open File).
Manual GDB dumps for ESP32 users
If using the Espressif ESP-IDF extension for VS Code, use this syntax instead (including the initial “>”):
> dump binary value trace.bin *RecorderDataPtr
Tracealyzer GDB Integration
A third method is to use the integrated Tracealyzer GDB support, that lets Tracealyzer connect to your GDB server to retrieve snapshots.
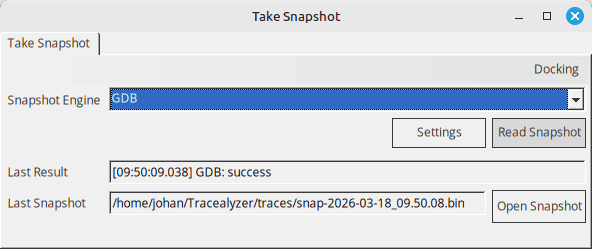
To use it, click the “Take Snapshot” button in Tracealyzer to open the Snapshot Tool window.

- Under “Snapshot Engine”, select “GDB”.
- Now click on the “Settings” button in the “Take Snapshot” window to open the GDB settings.
- Path to GDB: Enter the path to your arm-none-eabi-gdb. This is found in your toolchain folder.
- Path to image: Specify the path to the .elf file generated by your build.
- Command to initialize: should be “target remote localhost:<port>”, where <port> is the TCP port number of your GDB server.
- The other settings can remain unchanged. Save the Tracealyzer settings.
You can now use the “Take Snapshot” button in Tracealyzer, assuming a debug session is active in the GDB server. Note that snapshots can only be read when the system is halted. If the system is running, it will be halted when reading the snapshot.
