This is post #2 in Tracealyzer Hands On, a series of blog posts with handy tips how you can get more out of Tracealyzer.
One of the biggest problems in embedded development today, besides spending too much time debugging, is understanding what a software stack or demo that you didn’t write is doing. Embedded systems are becoming so complicated that the only way to build them in a cost-effective way and within a realistic time frame is to leverage existing components provided by 3rdparty stack providers and the microcontroller manufacturer. To be successful, we need to understand what this software is doing and how data flows around the application without spending weeks or months instrumenting or performing code reviews. In this post, we’ll examine how we can do this quickly and easily using the Tracealyzer communication flow.
Before using the communication flow, you’ll have to set up the recorder library and trace the application code that you are interested in. If you have never acquired a trace before, you’ll want to review the user manuals “Recording Traces” section for more details. This can be done in three simple steps:
- Open Tracealyzer.
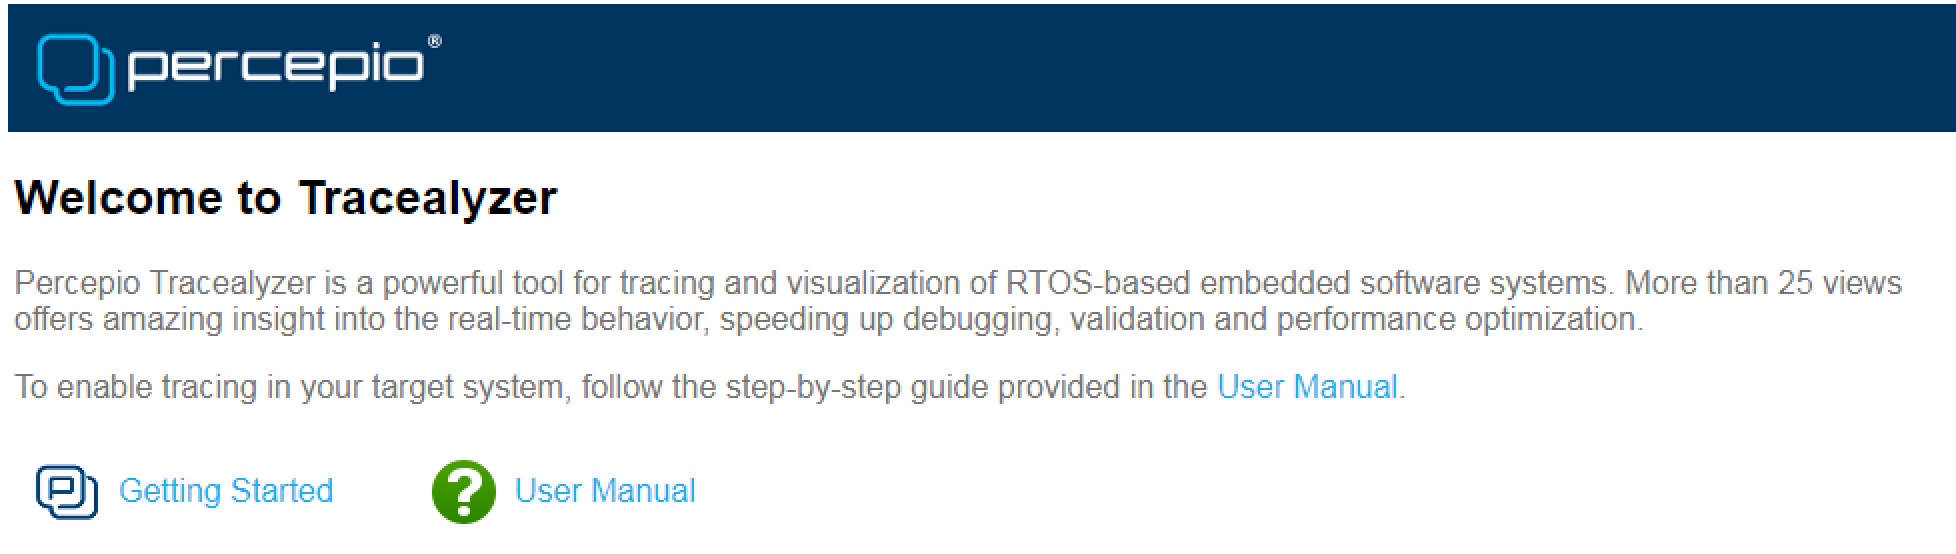
- Click the User Manual on the welcome screen next to the green question mark as shown below.
- Click on the Recording Traces section and review the material.
Once a developer has acquired an application trace, they are then ready to start exploring the applications communication flow. For this post, we will be examining the application flow from a FreeRTOS demo application that connects to Amazon Web Services (AWS). We acquired a trace using the base demo application on a STMicroelectronics IoT Discovery Node which supports FreeRTOS out of the box.
To get started with the communication and data flow analysis, after acquiring the trace and saving it, click on the Views dropdown from the menu and select “Communication Flow”.
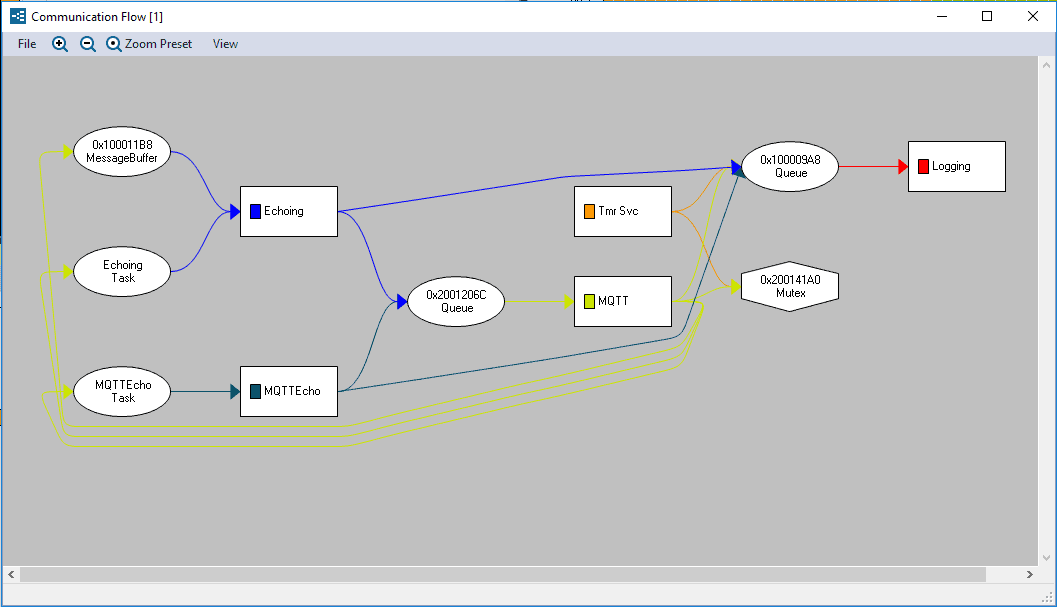
As you can see, there is a lot of useful information displayed. Let’s look at how we can understand what exactly is happening with the application.
First, you’ll notice that there are several different shapes in the view. The rectangles represent actors which in this example are the different tasks that are in the application. As you can see, there are five different tasks that are interacting:
- Tmr Svc
- MQTT
- MQTT Echo
- Echoing
- Logging
This doesn’t mean that there are only five tasks in the application but five tasks that are communicating and passing data around the application. To get a full listing, we would want to examine the Trace View.
Next, you’ll notice that there are ellipses and hexagons within the view. These shapes indicate the direction that data and communication is flowing. For example, the ellipses represent unidirectional communication and synchronization objects such as semaphores. The hexagon on the other hand is used for bidirectional communication such as a mutex.
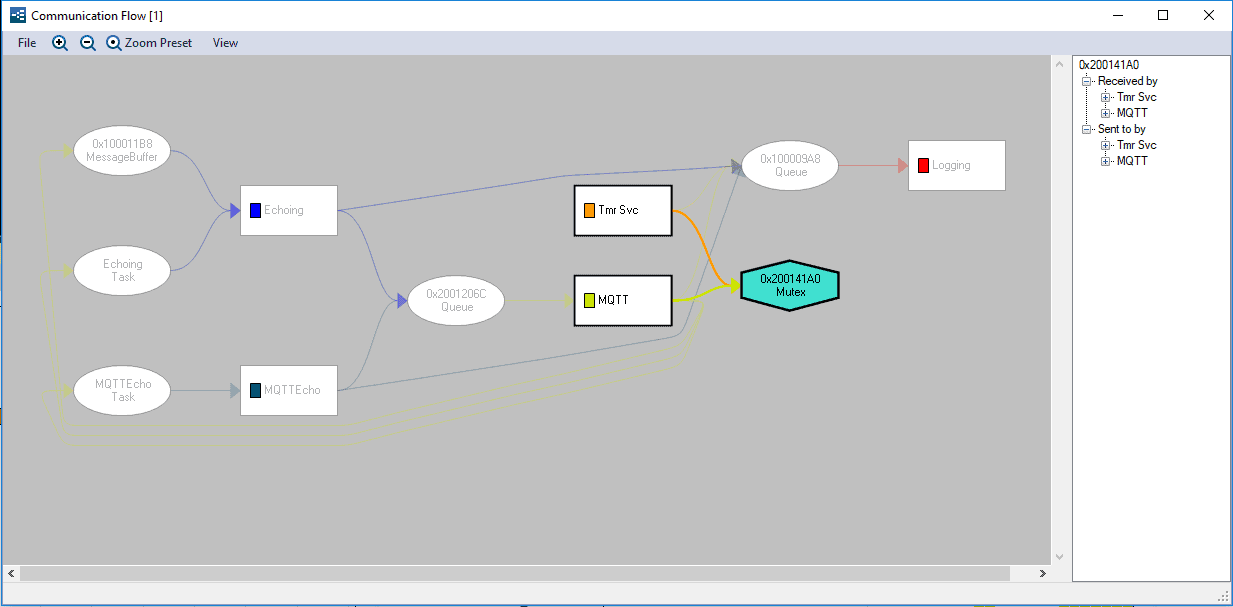
You can easily filter and trace the view by clicking on an object or actor that you are interested in. For example, if you click on the mutex, the mutex, Tmr Svc and MQTT shapes are all highlighted along with the lines showing how they interact. Additional information is shown on the right-hand side of the view. From this information, we can see that the mutex is both sent and received by both tasks. This tells us that there is a shared resource that is being protected by this mutex. You can see this behavior in the image below.
If we were trying to understand how the application works, we could review each actor and object and note how communication is flowing through the application. Note that there is a message buffer that is being populated and sent to the echo task. From looking at communication flow, one can deduce that the message buffer is data that will be sent to the AWS cloud. Echoing prepares the data and then puts the final message into a queue that will be sent to the MQTT task for transmission. At the same time, Echoing also posts a message in a queue that will record the action in Log task.
Whenever you want to learn more about an object or actor, simply double click on it to reveal an overview. The overview will filter all the events that involve that object and allow you to further investigate its behavior. For example, if you double click on the Echoing task actor, you’ll see this:
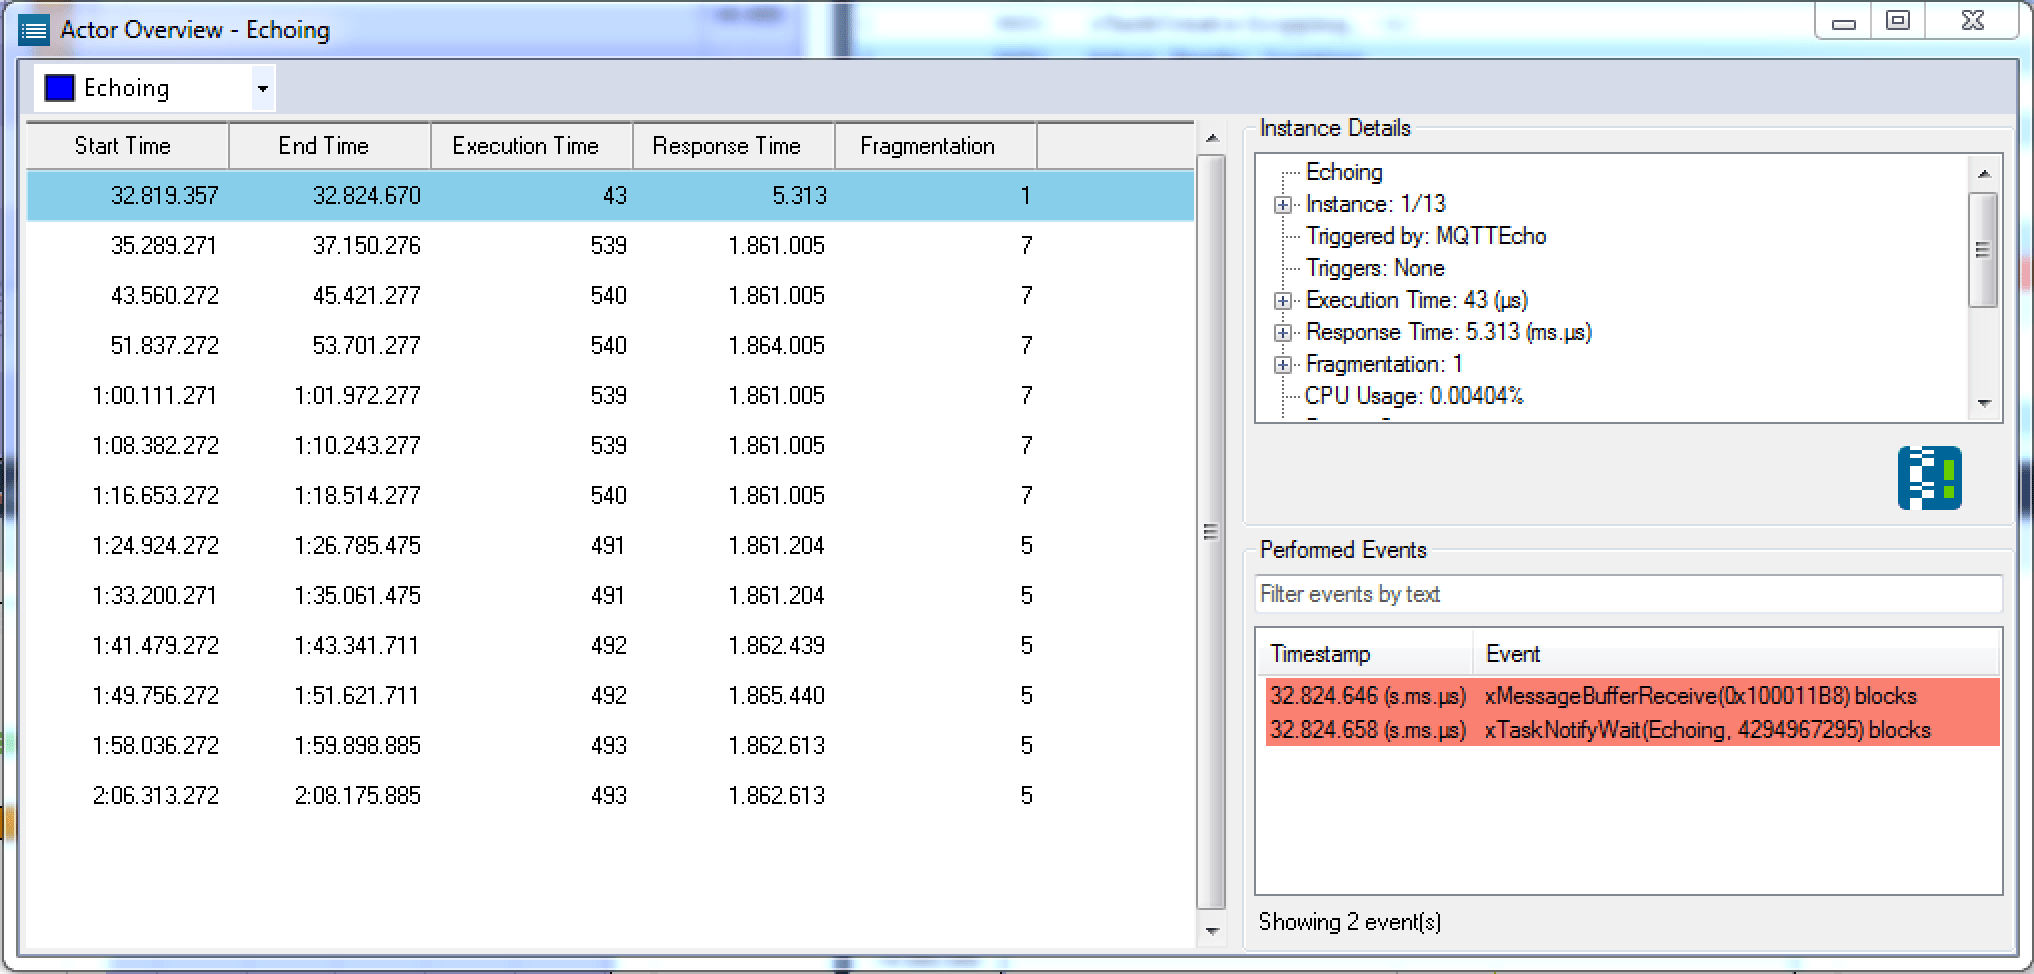
There are several useful pieces of information that we can glean from this overview:
- Every execution including useful information such as start, end, execution, and response times
- Individual instance details that include CPU utilization among other stats
- Performed events which include when the actor was blocked
We can use this information to not only learn about how an unknown code base is behaving but to also verify that the application is behaving the way that we expect it to. For instance, we might look through the Echoing actor overview and notice that the first time it executes its response time is milliseconds while subsequent executions it is nearly 2 seconds! We might see this and determine that there is something not right about the way the application is behaving, and we can then dive deeper to understand why the code is behaving this way.
The communication view is a very powerful tool for developers to understand how their application and third-party code is behaving. It can be used to debug issues with the way the application is communicating and can be used to just understand what the application is doing. The best way to fully understand how the communication view can benefit you is to acquire your own trace and experiment with the communication view.
Explore these features
If you are interested in experimenting with the features we have discussed in this post, you can download an evaluation of Tracealyzer here including pre-recorded demo traces so you can get started right away.