![]() There are a lot of processor architectures out there. Our trace recorder library that is included with Tracealyzer (e.g. for FreeRTOS) supports quite a few of them out of the box, but not all. Instead, we have made it quite simple to extend the trace recorder library to work with other processors – “Hardware Ports” as we call them.
There are a lot of processor architectures out there. Our trace recorder library that is included with Tracealyzer (e.g. for FreeRTOS) supports quite a few of them out of the box, but not all. Instead, we have made it quite simple to extend the trace recorder library to work with other processors – “Hardware Ports” as we call them.
To make a hardware port for a processor or processor family there are two main things that need to be defined.
- How to read the current time with high resolution (e.g. 1 µs), e.g. from a clock cycle counter.
- How to enable and disable interrupts, in order to avoid context-switches in the few microseconds it takes to store an event.
In this blog we will take a look at the hardware port for the Nios II CPU, which was included in the latest release (v4.3.8) of Tracealyzer. The Nios II is a soft-core CPU developed by Intel (formerly Altera) that can be programmed onto an FPGA.
Timer definitions
There are some definitions in trcHardwarePort.h that need to be specified, as described below. This file is found in the TraceRecorder/include directory.
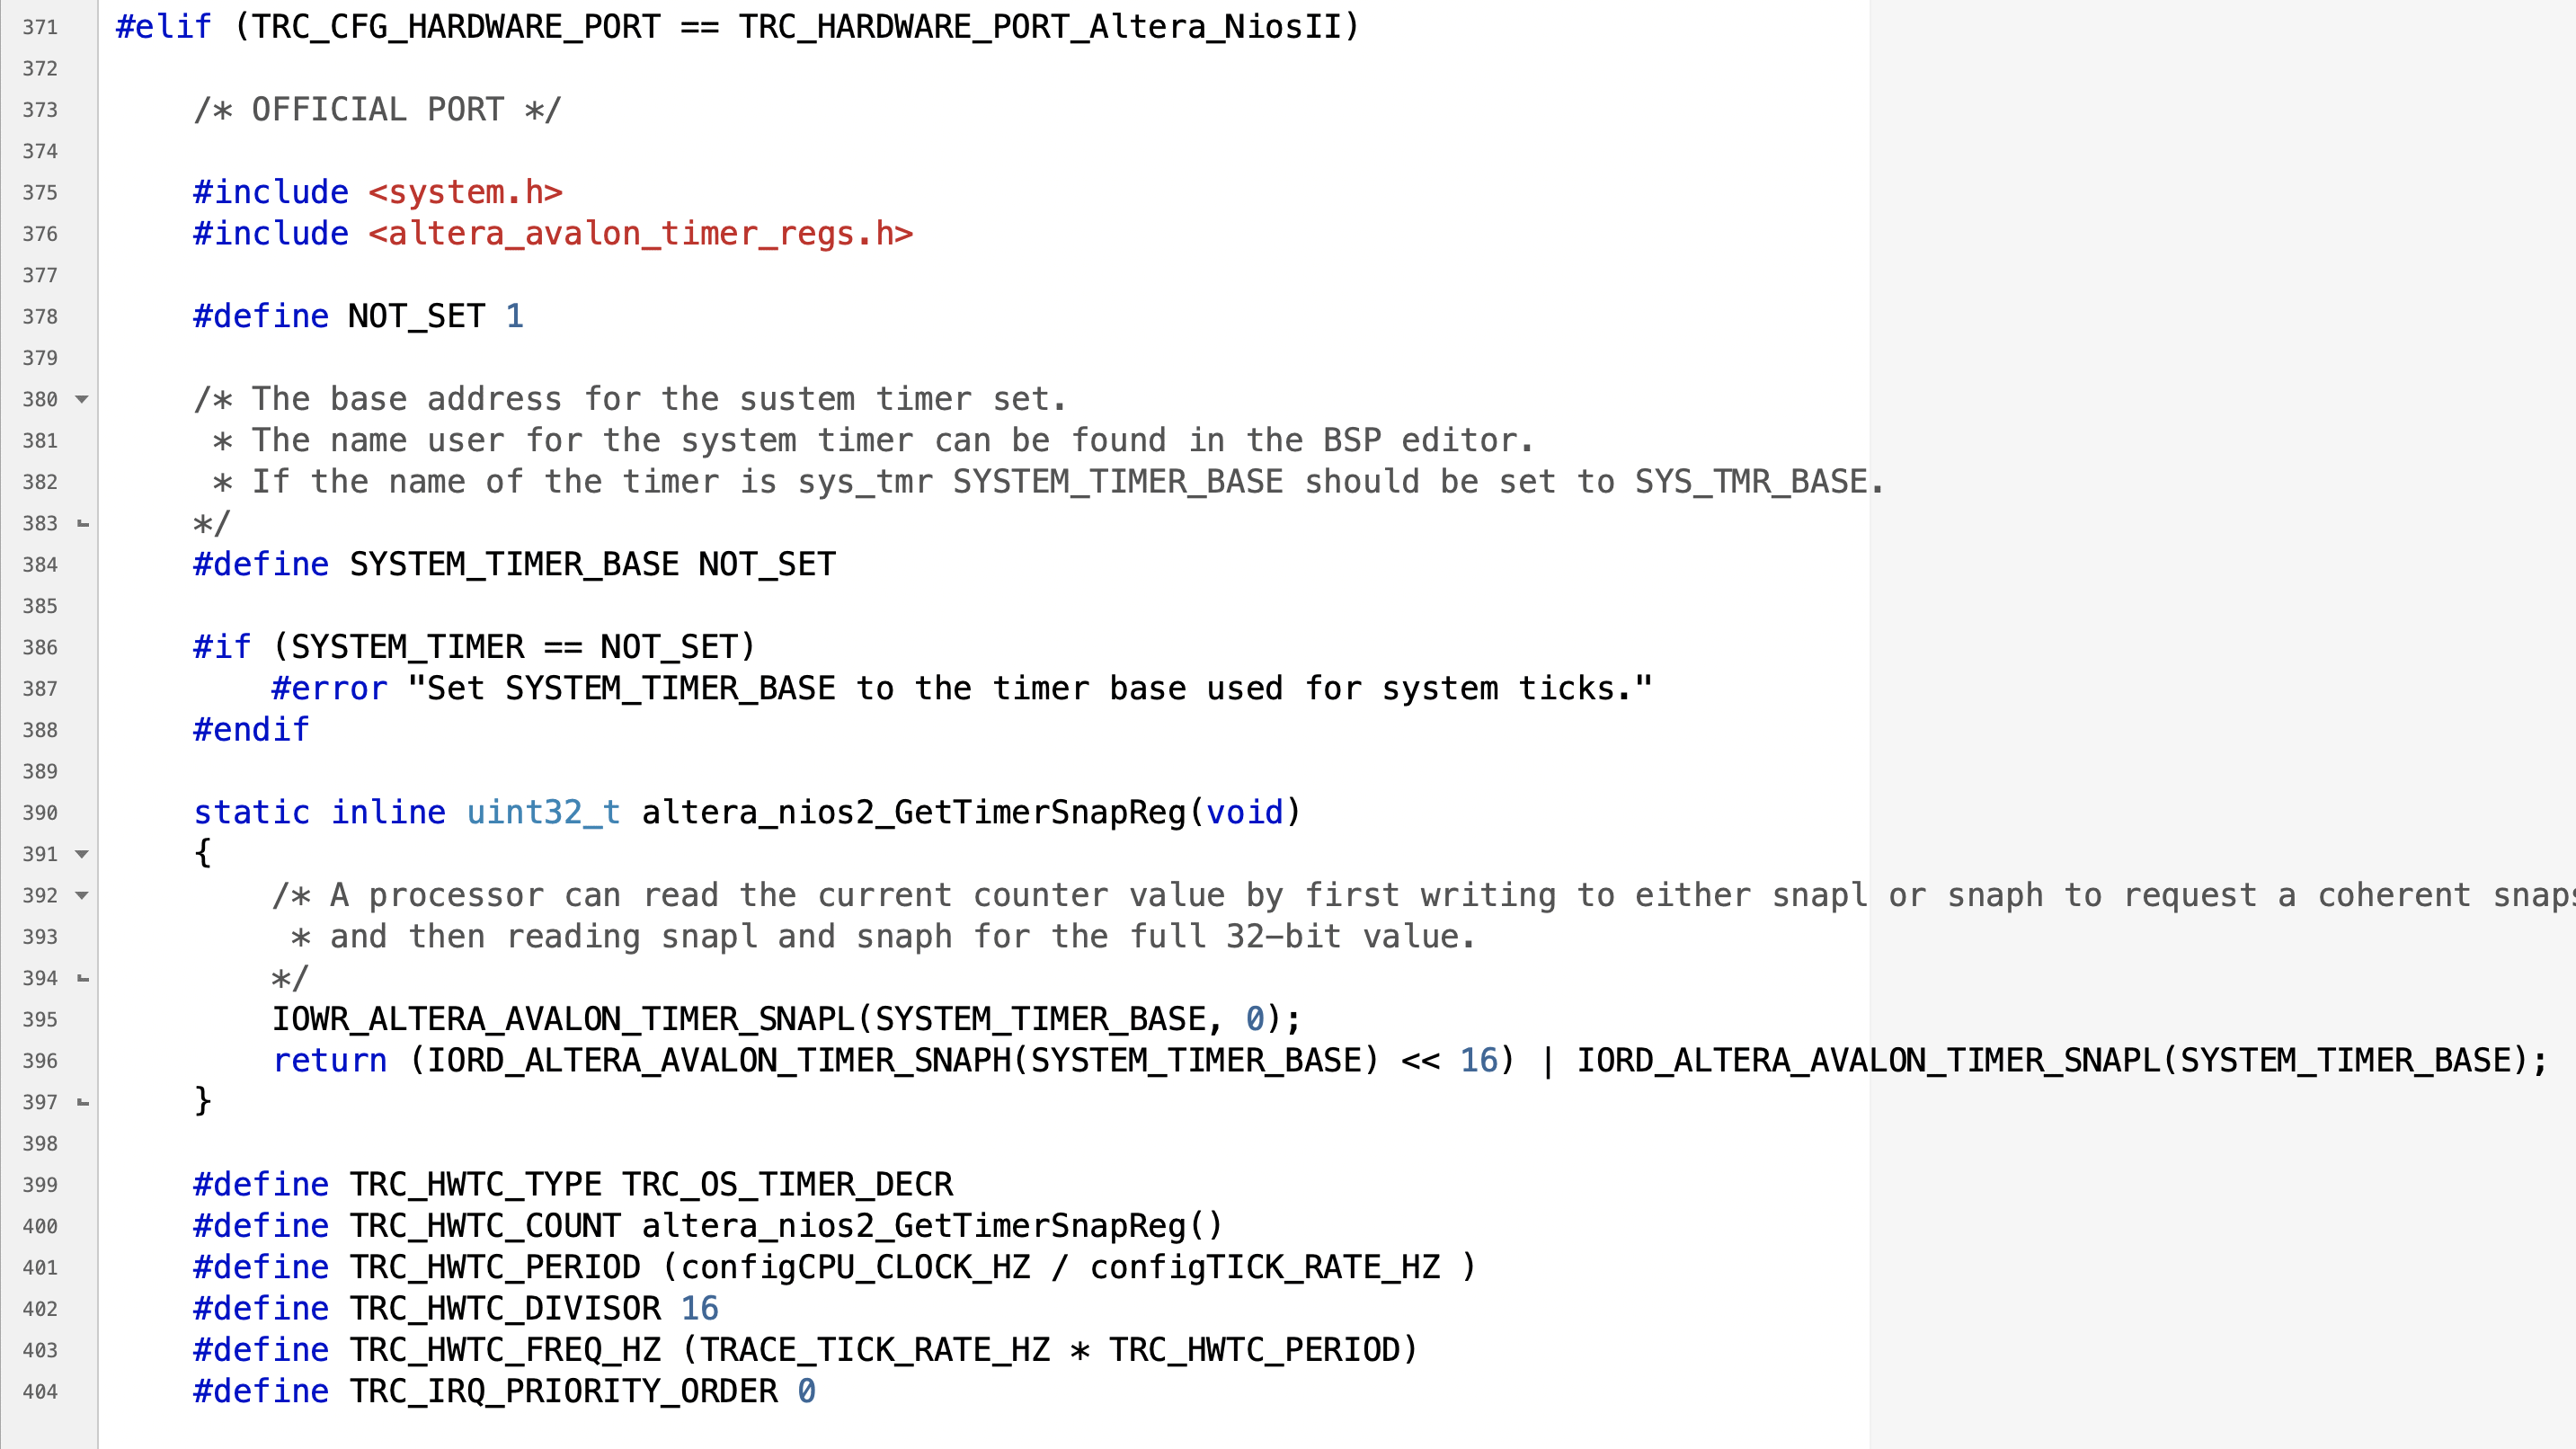
- TRC_HWTC_COUNT: How to read the current value from the counter/timer.
- TRC_HWTC_TYPE: Tells the type of timer/counter used for TRC_HWTC_COUNT, there are six different types to select from. Read more about the different types in trcHardwarePort.h.
- TRC_HWTC_PERIOD: The number of increments or decrements until the counter wraps around.
- TRC_HWTC_FREQ_HZ: The rate of TRC_HWTC_COUNT in Hz.
- TRC_HWTC_DIVISOR: Prescaler to reduce the bandwidth needed to store timestamps (avoids extra “XTS” events, only used for snapshot mode).
- TRC_IRQ_PRIORITY_ORDER: Set to 0 if a lower IRQ priority value means higher priority interrupt, or 1 if a higher IRQ priority value means higher piority.
Everything above should be wrapped in an #elif statement with the name of the hardware port as the condition. Names of all hardware ports are defined in trcPortDefines.h.
In the example of the Nios II port we can see that a helper function is needed to get the timestamp value from the timer. You typically don’t need to transform the timestamp value (e.g. to count upwards instead of downwards) since this information is provided via TRC_HWTC_TYPE.
Critical sections
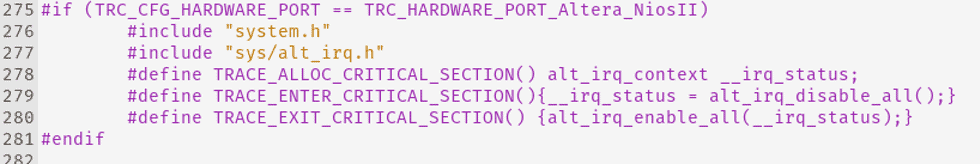
Three definitions are needed for the critical section:
- TRACE_ALLOC_CRITICAL_SECTION( ): A local variable declaration for storing the interrupt status.
- TRACE_ENTER_CRITICAL_SECTION( ): Disable all interrupts.
- TRACE_EXIT_CRITICAL_SECTION( ): Restore the previous interrupt status.
This is rather easy for the Nios II because the included board support software package provides functions to do this. For other platforms it may require more work and reading/writing direct to device registers.
Testing the Timestamping
When running in Snapshot mode, the Tracealyzer recorder does not save a full timestamp with each event, but rather the time since the previous event. This is handy when you want to test your timestamping, as it means that any errors will accumulate and be quite obvious after you have traced for a while.
So, record a trace with a lot of activity over say 60 seconds of wall clock time. In snapshot mode you typically don’t get the full trace (unless you have a LOT of RAM to spare), but only the latest events. But this is fine, since the recorder remembers the accumulated time and provides a full timestamp when you stop the trace. Verify that the final timestamp is at approximately 60 s.
Testing the Critical Sections
To make sure that the critical section macros in trcKernelPort.h work as expected, i.e. prevent any interrupts from occurring in a critical section, you have to do a bit more work. One way this can be tested is by checking that the tracing is stable over long time, even when many events are logged from interrupts.
When in snapshot mode, the recorder checks for nested events using a “recorder_busy” flag. If this flag is set when a recorder operation begins, it means that the previous recorder operation has been interrupted and therefore that your critical sections are not working as intended. If this happens, the recorder’s error handler prvTraceError is called, so the first step is to place a breakpoint in prvTraceError.
Next, set up a test application with the following characteristics:
- A task that generates a lot of task-level events using an infinite loop that calls
vTracePrintFrepeatedly (e.g, to log a counter). This should consume 100% of the CPU time at task level, and only be preempted by the RTOS tick interrupt. - Log ISR-level events by calling
vTracePrintFin a periodic interrupt. If your RTOS has a “OS tick hook” (like FreeRTOS), this can be used instead of defining a new interrupt handler.
Let this application run for one minute, stop tracing and check that the trace looks correct – it should load without warnings and the final timestamp should match the elapsed wall-clock time. Next, verify that output from vTracePrintF is correct and that values are being printed from both the task and the interrupt routine.
Repeat the test using different rates for the interrupt, and use rates that are not multiples of each other, e.g. 1000, 2003, 3995, 6783, in order to “strike” at different locations. If using the FreeRTOS tick hook, simply adjust the OS tick rate in FreeRTOSConfig.h.
That’s it. Now you have a verified hardware port for the Tracealyzer recorder library.
By Fredrik