This is a part of Tracealyzer Hands On, a series of blog posts with use-case examples for Percepio Tracealyzer®.
Have you ever seen your embedded system behave strangely and had that sinking feeling that your system might have a memory leak? While using dynamic memory allocation in a real-time embedded system is often frowned upon, there are many cases where it may be necessary. In this post, we are going to examine methods to detect memory leaks using Tracealyzer.
The first method to detect a memory leak is to use the Tracealyzer Memory Heap Utilization view. This view can be accessed by Views->Memory Heap Utilization. The Memory Heap Utilization view provides developers with the ability to view how memory is allocated and deallocated on the system heap during the desired trace window.
When a program starts executing, the allocation is initially zero (although the Tracealyzer plot starts level after the first allocation) and the heap utilization will rise as more and more objects are allocated. As objects are returned, we would observe the line returning to zero. An example taken from the FreeRTOS demonstration application can be seen below.
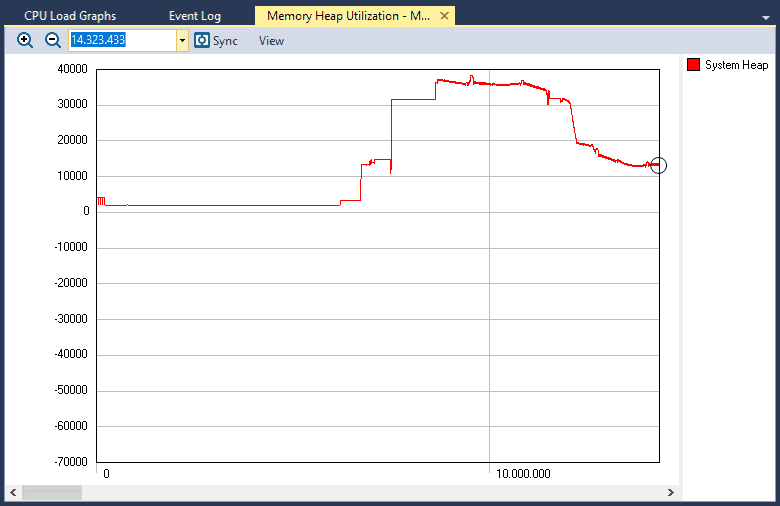
This Memory Utilization graph doesn’t show any obvious leaks.
We can see in this view that early in the program execution, the heap utilization starts flat where there are no calls to malloc or free. As the program executes, malloc is used to allocate objects and we see a positive value trend which makes sense since the system is allocating objects and initiating communication with the AWS server. Once a connection is established, we can see that the application stops allocating and begins deallocating temporary objects until it once again reaches a steady-state run-time for the heap.
Looking at the Memory Heap Utilization on its own can provide insights into how the heap is behaving but if we see any strange behavior it’s always useful to synchronize the view with other views such as the trace view or CPU load graph. Synchronizing the views will align them so that we can look point-to-point between views and get a feel for how the application is behaving. For example, in the image below, I’ve synchronized the Memory Heap Utilization and Trace View Horizontal views to investigate where the heap space is being allocated from. We can easily see that no memory is allocated from the heap until the MQTT task starts executing. (MQTT is a publish/subscribe communication protocol for IoT connectivity. Amazon FreeRTOS uses MQTT to communicate with the AWS IoT Core services.)
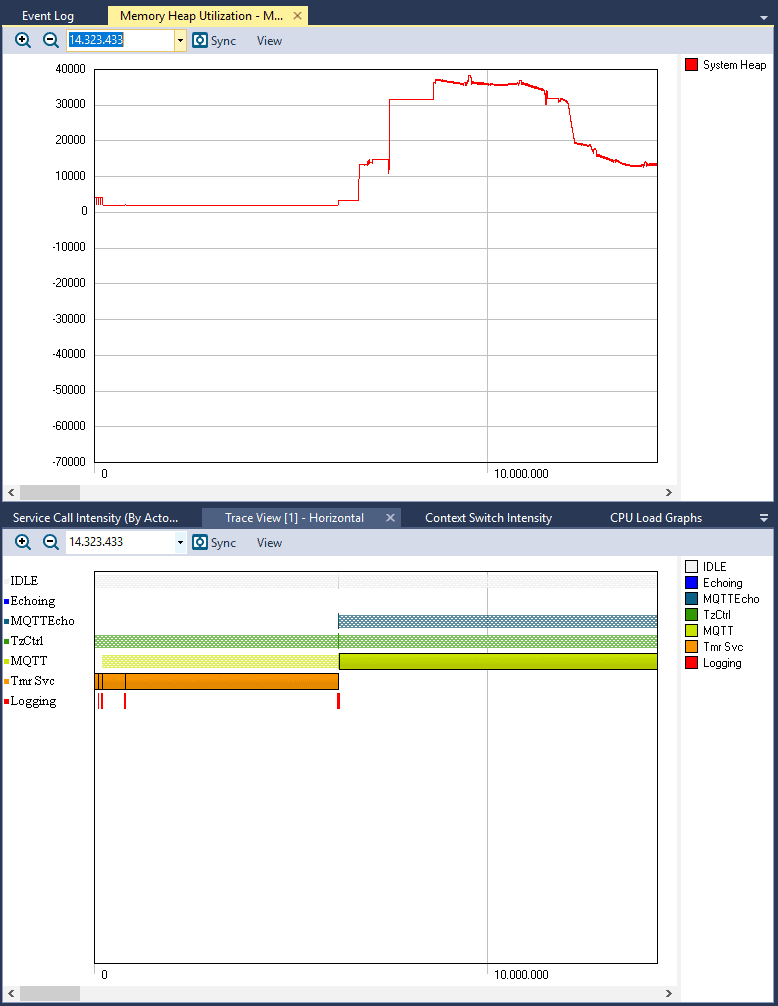
Synchronizing views allows you to see connections and draw conclusions that could otherwise have gone unnoticed.
If we had a memory leak in our software, we would expect to see memory utilization slowly creep up over time since there would be more calls to malloc than there would be to free.
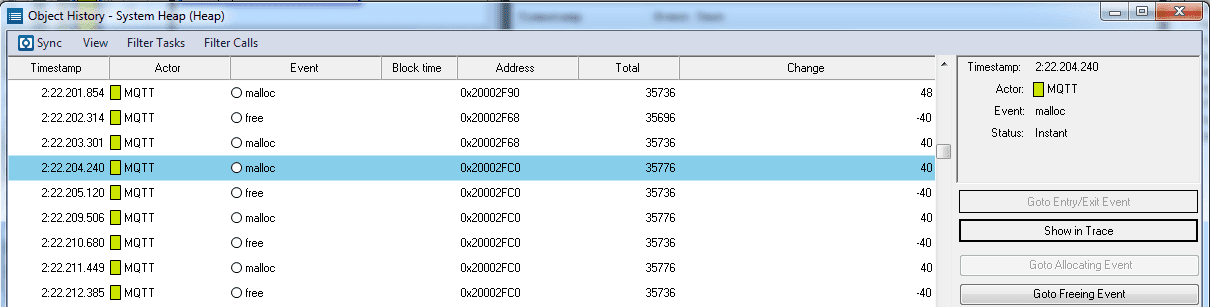
The second method that a developer can use within Tracealyzer to monitor for a memory leak is to count malloc and free events. This sounds like a tedious manual process, but it can easily be done using the Object History view. The steps are straight forward.
- Open the All Views option in the left-side navigation bar.
- Locate the Object History view, double-click to open it and select the “System Heap” object. You now see all malloc and free events in a list, along with details on allocation size and the total amount allocated.
- Click Filter Calls and then “Show Remaining Only”. The view now shows the remaining allocations, i.e. cases where you have a malloc without a corresponding free.
- Some remaining allocation may be normal, like intentional one-time allocations during the startup (e.g. FreeRTOS tasks). But any memory leaks will appear clearly when the “Show Remaining Only” filter is used – typically as multiple remaining allocations spread out over the trace.
To learn more about a specific malloc or free call, double click on the list entry to show the location in the trace. Within the Object History window, on the right-hand side, you will also notice two buttons “Goto Allocating Event” and “Goto Freeing Event”. Using these, you can find where the currently selected allocation is released, or vice versa. Note that a single click will only change the selection in the Object History view, while a double-click also updates the trace view to show this location.
These are just a few ways that developers can keep an eye on their heap to ensure that they don’t have a slow memory leak that will cause their system to crash unexpectedly. With this monitoring capability in place, developers can now rest easy knowing they don’t have a leaky system.
Explore these features
If you are interested in experimenting with the features we have discussed in this post, you can download an evaluation of Tracealyzer here with a pre-recorded demo trace so you can get started right away.