
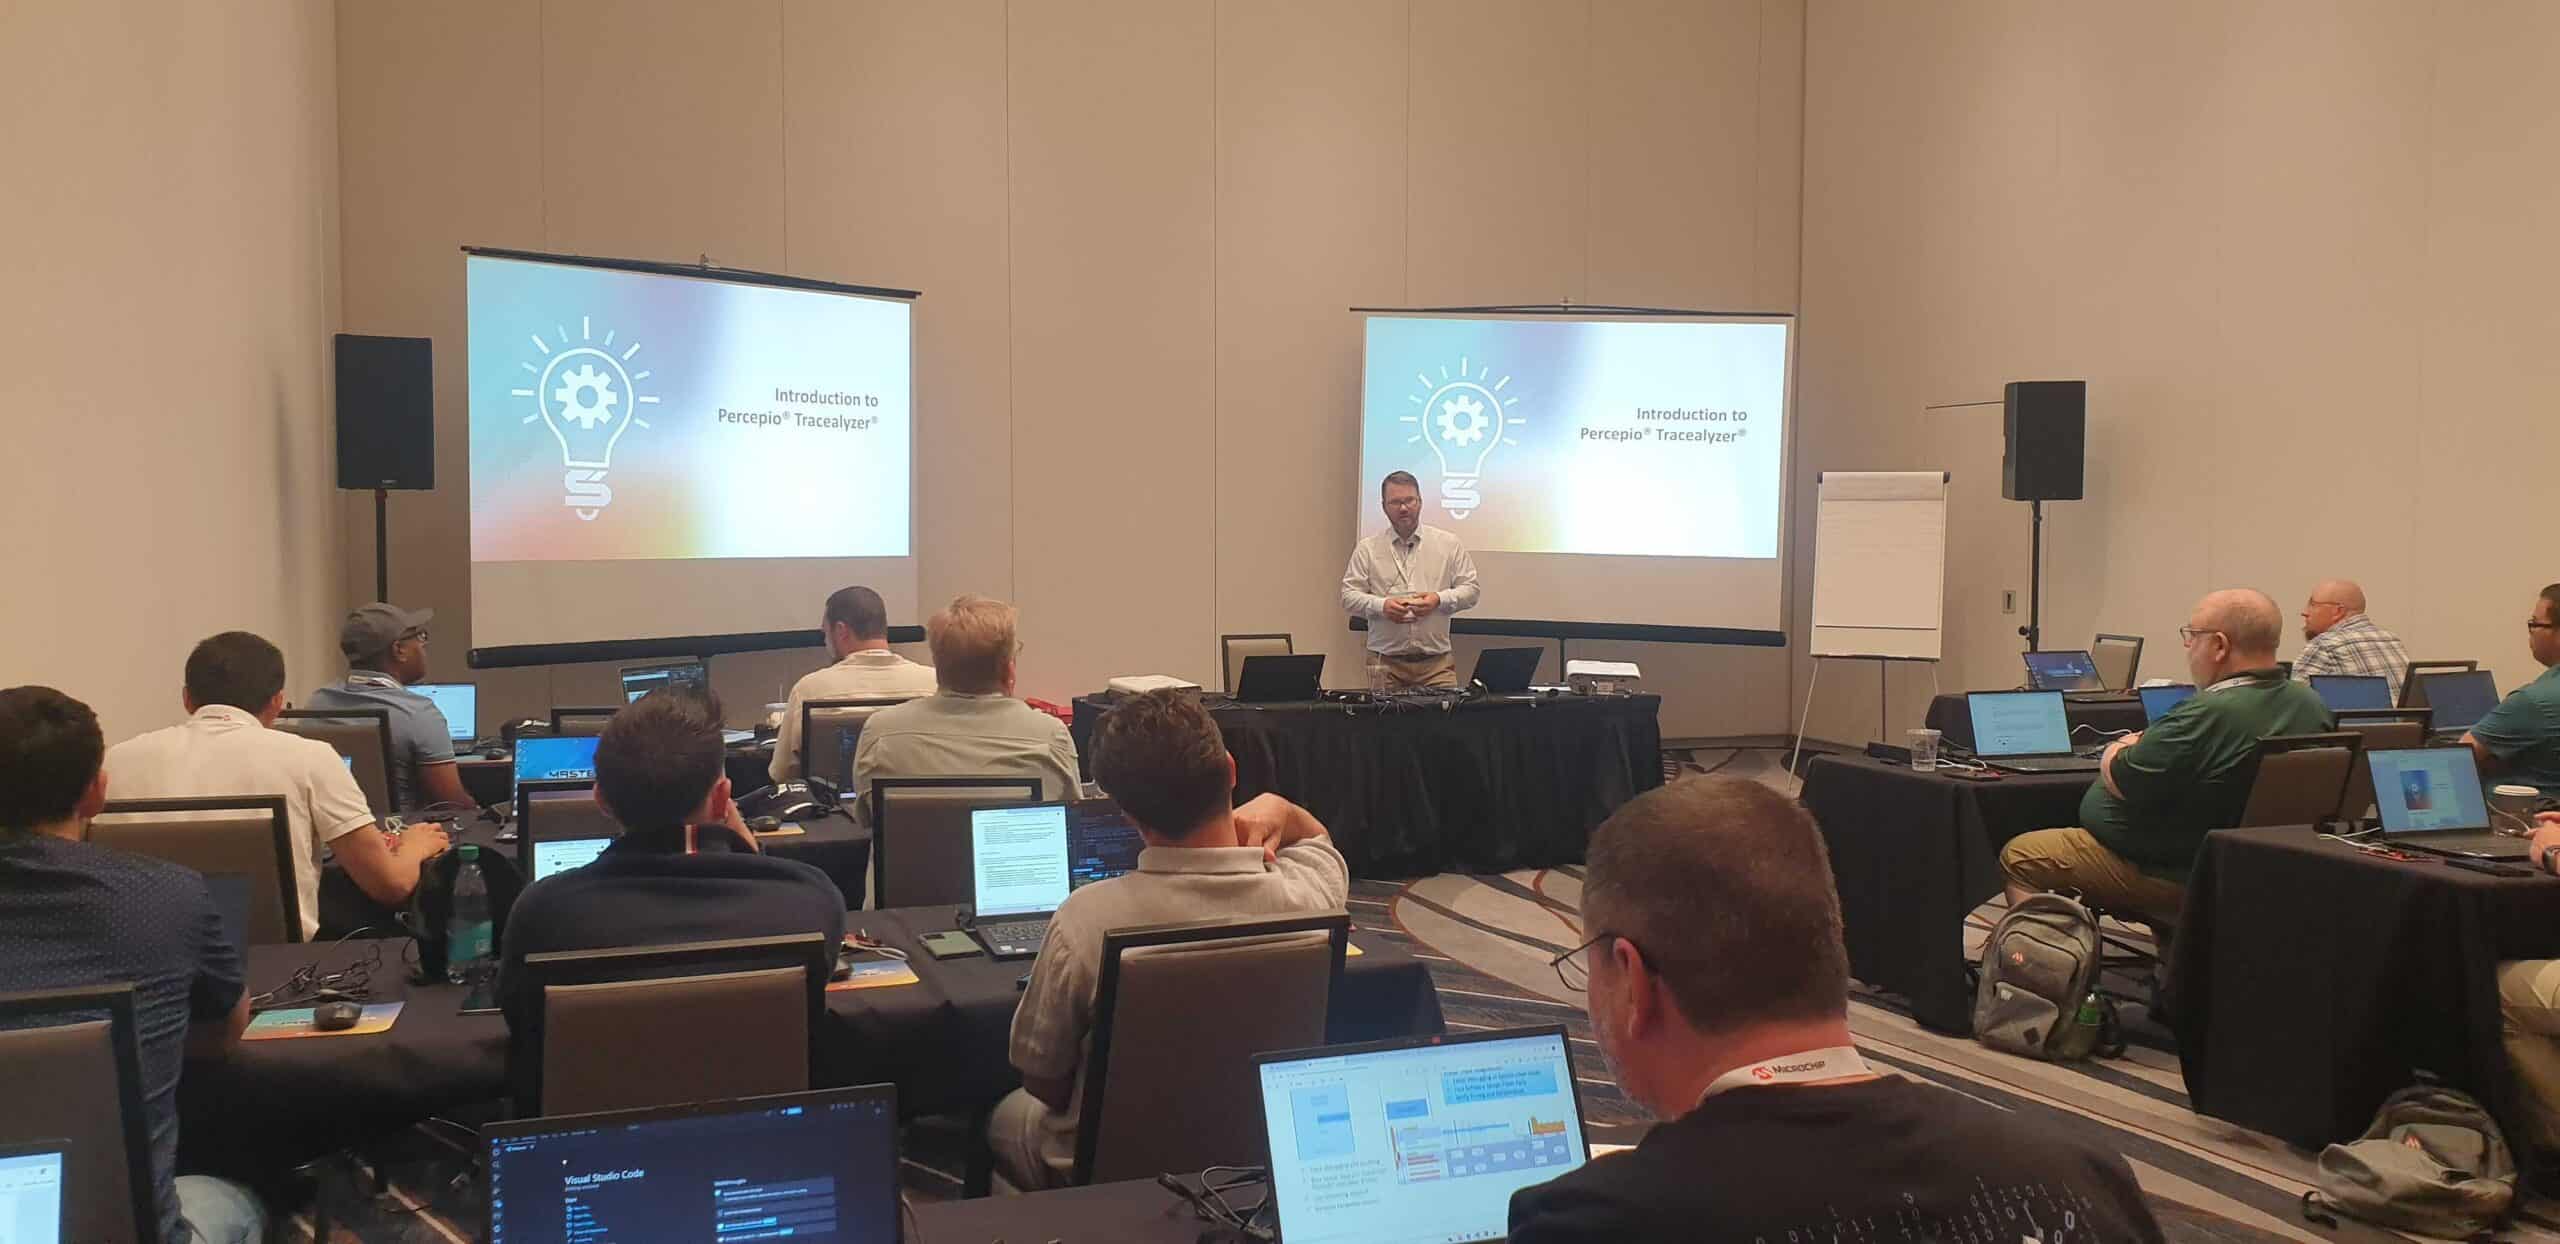
Johan Kraft introduces Percepio Tracealyzer during the hands-on Zephyr RTOS debugging class at Microchip MASTERs 2026 in Phoenix.
Microchip MASTERs 2026 brought embedded developers together in Phoenix for several days of technical training, hands-on learning and conversations around the challenges engineers are solving every day.
Percepio was there, with Founder and CTO Johan Kraft and Product Lead Andreas Klintemyr joining the Microchip community to meet developers, customers and industry partners.
One of the highlights of the week was a hands-on training class led by Johan as part of the MASTERs program: “Mastering Zephyr RTOS Debugging with Percepio Tracealyzer: Visualize, Analyze, Optimize.”
Rather than simply demonstrating Tracealyzer, the class put participants directly into the debugging process. Attendees worked with a multithreaded Zephyr application, diagnosed timing issues using traces and used Tracealyzer to understand what was really happening inside the running system.
Why RTOS debugging gets difficult
Some software problems announce themselves clearly. Others do not.
In an RTOS-based application, synchronization issues, starvation, priority inversion and deadlocks can depend on the precise timing and interaction of multiple threads. That can make them difficult to reproduce and even harder to diagnose using conventional debugging techniques.
Breakpoints can stop the very timing behavior an engineer is trying to investigate, while adding print statements can alter system timing enough to change or even hide the problem.
This is where trace-based debugging becomes particularly useful. Tracealyzer provides a visual view of an application’s runtime behavior, including thread execution, interrupts, context switches and RTOS kernel events. Instead of trying to infer what happened from the source code alone, developers can examine how the system actually behaved over time.
From coffee and tea to real RTOS behavior
The MASTERs class made these concepts tangible through a series of hands-on labs built around a deceptively simple application: a Zephyr-powered coffee and tea maker.
Participants began with two threads handling coffee and tea orders. Without proper synchronization, the brewing steps could become interleaved, providing a practical example of the kinds of concurrency problems that can occur in multithreaded applications.
The first challenge was to identify the problem and introduce mutual exclusion so that the shared resource was handled correctly. But solving one problem was only the beginning.
As additional workload was introduced, participants could see how changes elsewhere in the application affected response times and CPU utilization. In one exercise, adding a maintenance thread increased the time required to complete orders by 58%, even though the individual coffee and tea processing steps had not changed.
Using Tracealyzer, participants could move beyond observing that the application had become slower and investigate why.
Seeing what the system is really doing
Throughout the exercises, participants used Tracealyzer to examine system behavior from several perspectives.
The Trace View provided a timeline of thread execution and Zephyr API calls, making it possible to see when threads were executing, waiting or being blocked. CPU Load Graphs showed how processor time was distributed between threads and how that distribution changed over time.
Other visualizations helped participants identify variations and anomalies in thread timing and move from a high-level symptom down to the sequence of events responsible for it.
This top-down approach is particularly valuable when the symptom is known but the source of the problem is not. Instead of deciding where to place a breakpoint before understanding the problem, developers can use trace data to find the interesting part of the execution first and investigate from there.
Experimenting with scheduling and waiting
Later exercises explored how seemingly small implementation decisions can have significant effects on runtime behavior.
Participants experimented with scheduling priorities and then used Tracealyzer to compare the impact on response time and CPU load. They also examined the difference between consuming processor time while waiting and using suspended waits that allow other threads to execute.
The goal was not simply to arrive at the “correct” implementation. It was to develop a repeatable way of asking: What changed? What effect did it have on the system? And can we see why?
That ability becomes increasingly important as embedded applications grow more concurrent and complex.
Building a better picture of runtime behavior
The class reinforced a principle at the heart of trace-based debugging: source code tells you what a system is supposed to do. Runtime observability shows you what it actually did.
With Tracealyzer, developers can visualize execution patterns, inspect CPU utilization, analyze timing and response behavior, and drill down into the events surrounding an anomaly.
For Zephyr developers in particular, that means being able to connect familiar RTOS concepts such as threads, scheduling, mutexes and waiting with their real impact on a running application.
And because Tracealyzer supports both snapshot and streaming trace, the same approach can extend beyond short debugging sessions to profiling and longer-running tests.
More than a training session
MASTERs was also an opportunity to connect with the wider embedded community. Throughout the conference, Johan Kraft and Andreas Klintemyr met with developers, customers and partners to discuss the challenges they are seeing in embedded software development and where better runtime visibility can help.
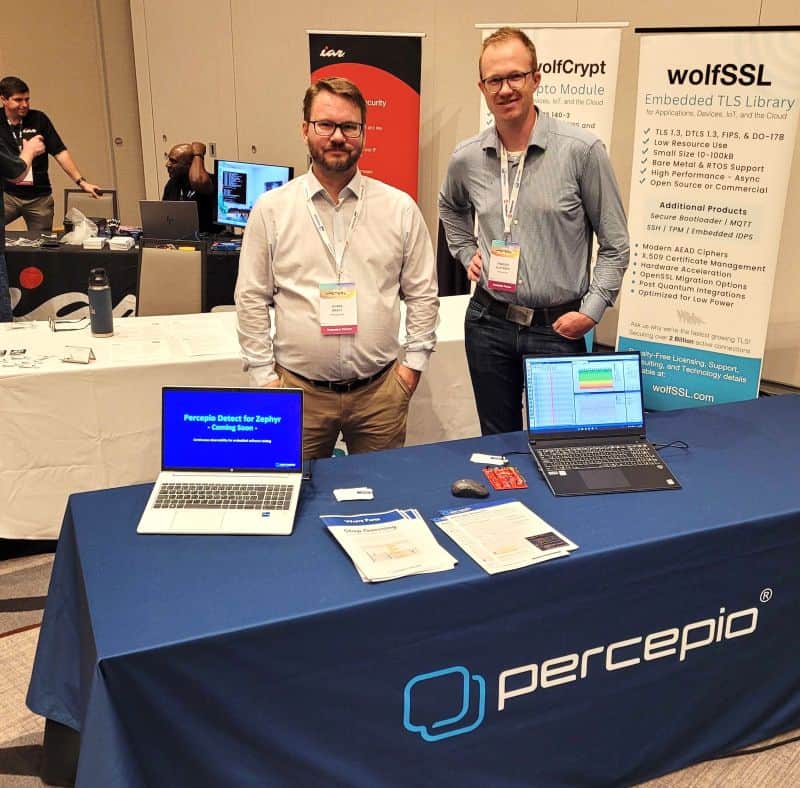
A big thank you to Microchip MASTERs 2026, as well as everyone who joined the training and stopped to speak with us during the week.
We hope to see you again next year.
Want to see what your RTOS is doing at runtime?
Explore Percepio Tracealyzer and discover how visual trace diagnostics can help you understand, debug and optimize complex embedded software.
Start your 10-day Tracealyzer evaluation and see it in action.
Percepio offers Tracealyzer licenses to qualifying academic institutions and students. Please visit the Licensing page to review the terms and apply for an academic license.