
A Real-Time Operating System (RTOS) is an operating system designed for predictable execution in embedded systems. RTOSes are commonly used for applications with real-time requirements, but are also used to simplify the development of complex embedded applications. Whether you are designing safety-critical control systems, connected IoT devices, or industrial automation firmware, understanding how an RTOS works — and how to analyze its runtime behavior — is essential for building reliable products.
This guide covers the core concepts every embedded developer needs to know about RTOS design, architecture, and the most common runtime pitfalls. Each section below links to a deeper article for those who want to go further.
What Is an RTOS?
A real-time operating system is an operating system designed for predictable execution in embedded systems. RTOSes are commonly used for applications with real-time requirements, but are also used to simplify the development of complex embedded applications. Unlike general-purpose operating systems, an RTOS is designed to provide predictable scheduling and timing behavior.
A core function of an RTOS is multitasking: dividing application code into smaller, independent units called threads (called tasks in some RTOSes, including FreeRTOS) that execute seemingly in parallel. This makes it far easier to design applications with multiple concurrent functions — such as control loops, communication handling, and HMI updates — without tangling them into a single, unmanageable program. Depending on the RTOS, the software platform may also include device drivers, networking, file systems, connectivity stacks and other services. Zephyr, for example, provides a broad embedded software platform, while FreeRTOS Kernel is primarily an RTOS kernel.
RTOS kernels are typically designed for low memory and runtime overhead, making them suitable even for resource-constrained microcontrollers. Popular examples include FreeRTOS, Zephyr, Eclipse ThreadX, and VxWorks.
RTOS Architecture
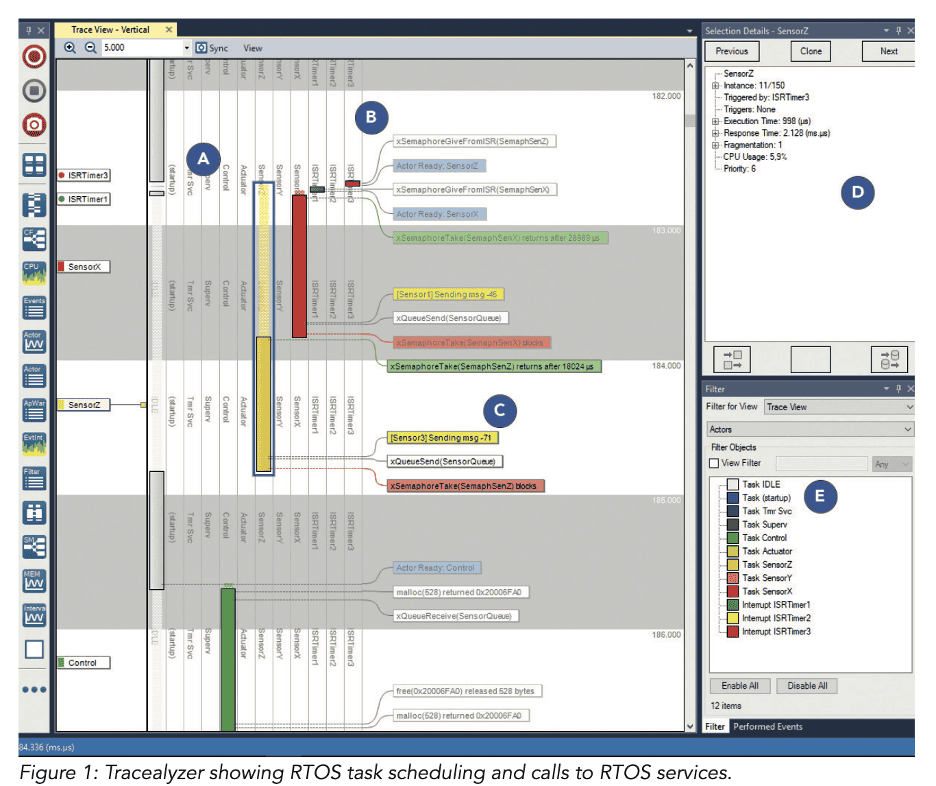
An RTOS kernel manages threads, scheduling, and inter-thread communication. Its key architectural components are:
Threads and Priorities
Each thread is an independent execution context with its own stack and a developer-assigned priority level. Most RTOSes implement fixed-priority scheduling (FPS): the scheduler always selects the highest-priority thread from the set of threads that are ready to execute. This keeps the scheduler small, highly optimized, and easy to validate.
Getting priorities right matters. High-priority threads that consume too much processor time can starve lower-priority threads, causing missed deadlines or an unresponsive system. Understanding thread interactions — not just per-thread CPU time — is essential.
Synchronization Objects
Threads in a real-world application are never fully independent. They share hardware resources, pass data, and respond to interrupt events. RTOSes provide standard primitives for this:
- Semaphore — a signal between threads or interrupts that triggers thread activation. A thread blocks waiting for the semaphore; an ISR or another thread “gives” it to unblock the waiter.
- Mutex — used for mutual exclusion, protecting a critical section so that only one thread accesses a shared resource at a time. A mutex tracks its owning thread and can temporarily boost that thread’s priority to help prevent priority inversion.
- Counting semaphore — manages a pool of limited shared resources using an internal counter.
- Queue — a FIFO buffer for passing messages between threads, decoupling senders and receivers.
Using unprotected global variables for inter-thread communication is a common mistake: a thread switch at exactly the wrong moment can create race conditions that are difficult to reproduce and even harder to diagnose.
RTOS on ARM
ARM Cortex-M processors are widely used for RTOS-based embedded systems. Leading RTOSes including FreeRTOS, Zephyr, Eclipse ThreadX, and VxWorks have mature ARM support. ARM Cortex-M processors commonly provide hardware features useful for RTOS-based systems, such as interrupt prioritization, system timers and, depending on the implementation, memory protection and hardware trace capabilities.
Depending on the Cortex-M implementation, hardware tracing capabilities such as ITM/DWT data trace and ETM instruction trace can enable non-intrusive RTOS analysis, allowing tools like Percepio Tracealyzer to capture detailed runtime behavior with low impact on the system under test.
RTOS Memory Protection
Memory protection is a critical aspect of RTOS system design, especially in safety-relevant applications. An RTOS that supports memory protection can use the processor’s MPU, where available, to define boundaries between thread stacks and data regions, helping ensure that a faulty thread cannot corrupt the memory of another thread or the RTOS kernel itself.
When an MPU violation occurs, the processor raises a fault exception that the RTOS can catch, log, and report — turning a latent memory corruption bug into a detectable, diagnosable event. Effective memory protection requires careful configuration of thread regions, stack sizes, and privilege levels.
RTOS Scheduling
RTOS scheduling determines which thread runs at any given moment. In fixed-priority preemptive scheduling, a higher-priority thread can preempt a lower-priority thread whenever it becomes ready to run. This can happen due to interrupts, RTOS operations, timeouts, or periodic timers.
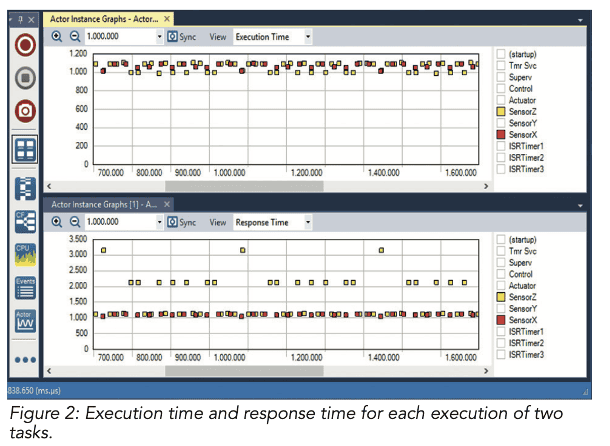
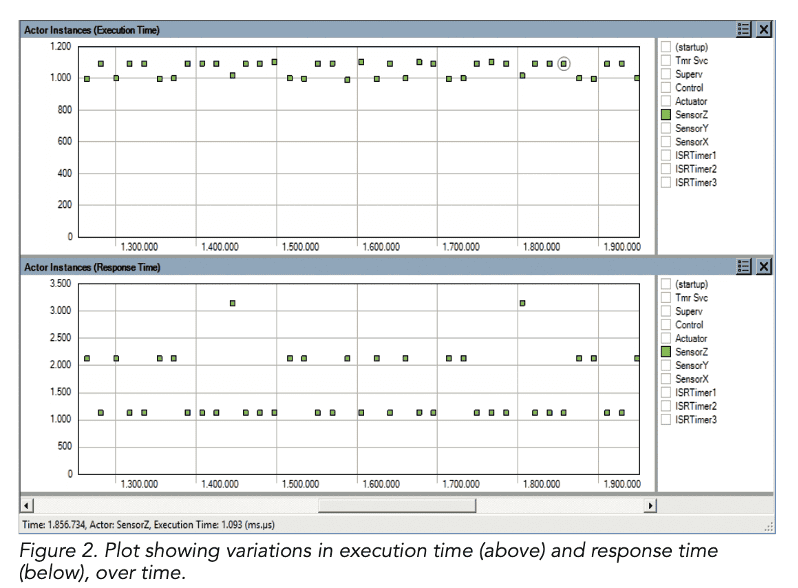
A critical distinction to understand is execution time versus response time. Execution time is the actual CPU time a thread consumes. Response time is the total elapsed time from thread activation to completion — which includes all preemptions by higher-priority threads and ISRs. A thread with a long response time is not necessarily a slow thread; it may simply be one that is repeatedly interrupted by higher-priority work. In one traced example, a thread’s peak execution time was 1,087 µs — but its peak response time reached 3,255 µs. The difference was caused entirely by interference from other threads and interrupts, not by the thread’s own code. Identifying the true cause requires RTOS-aware analysis, not just per-thread profiling.
Read more: RTOS Scheduling and Analysis with Tracealyzer
RTOS Priority Inversion
Priority inversion occurs when a high-priority thread depends on a resource held by a lower-priority thread, and unrelated medium-priority work delays the lower-priority thread from releasing that resource. A well-known example occurred on NASA’s Mars Pathfinder mission, where priority inversion contributed to system resets.
The classic scenario: a high-priority thread (Thread H) waits to acquire a mutex held by a low-priority thread (Thread L). If an unrelated medium-priority thread (Thread M) preempts Thread L before it releases the mutex, Thread H remains blocked while the medium-priority work runs. The effective priority of the work Thread H depends on has been inverted.
Most RTOSes address this with priority inheritance: the RTOS temporarily raises Thread L’s priority to match Thread H’s, preventing interference from Thread M. Priority inversion can also arise in subtler ways — for example, through a full message queue causing an unexpected blocking cascade that prevents a thread from resetting a watchdog timer in time.
Read more: RTOS Semaphores, Queues, and Priority Inversion
RTOS Thread Profiling
Thread profiling is an essential step in understanding and optimizing the runtime behavior of RTOS-based applications. Key performance metrics include execution time, response time, and CPU load per thread — and understanding the difference between them is critical. These profiling concepts apply across supported RTOSes, including FreeRTOS, Zephyr, Eclipse ThreadX, VxWorks, and others.
Standard program-counter sampling profilers give only an aggregate picture and can miss sporadic overruns that cause real problems. RTOS-aware tracing records detailed scheduler events, ISR activations, and kernel object operations, and can present execution time and response time as time-series plots and histograms — making it straightforward to identify whether a timing problem is caused by the thread itself or by interference from higher-priority work.
Read more: FreeRTOS Performance Analysis with Tracealyzer
RTOS Mutex and Deadlock
A mutex protects a critical section — a block of code that must only be executed by one thread at a time. When a thread acquires a mutex, all other threads attempting to acquire it are blocked until the owner releases it.
Deadlock occurs when two or more threads each wait for a resource held by the other, forming a circular dependency from which none can escape. The system stalls silently — typically manifesting as a hang or an unexpected watchdog reset, with no obvious error message pointing to the root cause.
ISR Design in RTOS
Interrupt Service Routines (ISRs) interact directly with RTOS scheduling and must be designed with care. ISRs generally cannot call blocking RTOS services and should only use APIs that the RTOS explicitly supports from interrupt context. They should also complete quickly to avoid disrupting the scheduling of other threads.
Poor ISR design is a common source of hard-to-reproduce bugs: an ISR that runs too long can introduce jitter in periodic threads, miss subsequent interrupts, or corrupt shared state if it preempts a thread at a vulnerable point. The full interaction between ISRs and threads — which queues and semaphores are touched, and in what order — is often invisible without RTOS-aware tracing.
RTOS Idle Thread Measurement
Most RTOS kernels include an idle thread — the lowest-priority thread that runs whenever no other thread is ready to execute. Measuring how much CPU time the idle thread consumes is a simple way to gauge overall CPU load: a system spending 40% of its time in the idle thread has approximately 60% CPU utilization.
Idle thread measurement is also valuable for detecting gradual CPU load increases over time, which can be an early warning of performance degradation, memory fragmentation effects on allocator time, or runaway background processing. Tracking idle thread time across different system states gives a clear baseline for performance testing and regression detection.
Runtime Visibility with Percepio Tracealyzer
Understanding what your RTOS is doing at runtime requires more than reading source code — it requires visibility into the real sequence of events: which threads ran, for how long, which priorities were active, which queues filled up, and where blocking occurred.
Percepio Tracealyzer is an RTOS-aware visualization and analysis tool that captures detailed runtime behavior, including RTOS scheduling, interrupts, RTOS API calls, and custom application events, and presents it in over 25 interconnected views. It supports FreeRTOS, Zephyr, Eclipse ThreadX, VxWorks, and other leading RTOSes, with support for ARM Cortex-M targets.
Evaluate Tracealyzer to explore it with your own application, or buy Tracealyzer to bring RTOS-aware visualization and analysis into your development workflow.
Percepio offers Tracealyzer licenses to qualifying academic institutions and students. Please visit the Licensing page to review the terms and apply for an academic license.