By Niclas Lindblom, Senior FAE at Percepio AB.
Percepio has recently introduced Tracealyzer for ThreadX, which is good news for developers using Renesas Synergy. As you might know, the Renesas Synergy Software Package (SSP) includes the ThreadX RTOS and middleware from Express Logic, supporting Synergy S1, S3, S5 and S7 processors.
Tracealyzer is a runtime analysis tool for embedded software developers, intended for debugging and performance analysis of firmware application using an RTOS, such as ThreadX. With Tracealyzer, you can see how the RTOS executes your code, the timing of your threads and ISRs, and how they call RTOS and middleware API functions.
The visualization is based on software events from lightweight tracing code in the target software. But you don’t need to add this tracing code yourself, as the ThreadX RTOS and middleware already provides tracing for over 500 kinds of system events. All that is needed is to enable this option in your ThreadX project.
Enabling ThreadX tracing
To enable the built-in support for event tracing in ThreadX, you need to define the symbol TX_ENABLE_EVENT_TRACE to include the tracing code when building the RTOS kernel, and add a call to the function tx_trace_enable to enable the tracing.
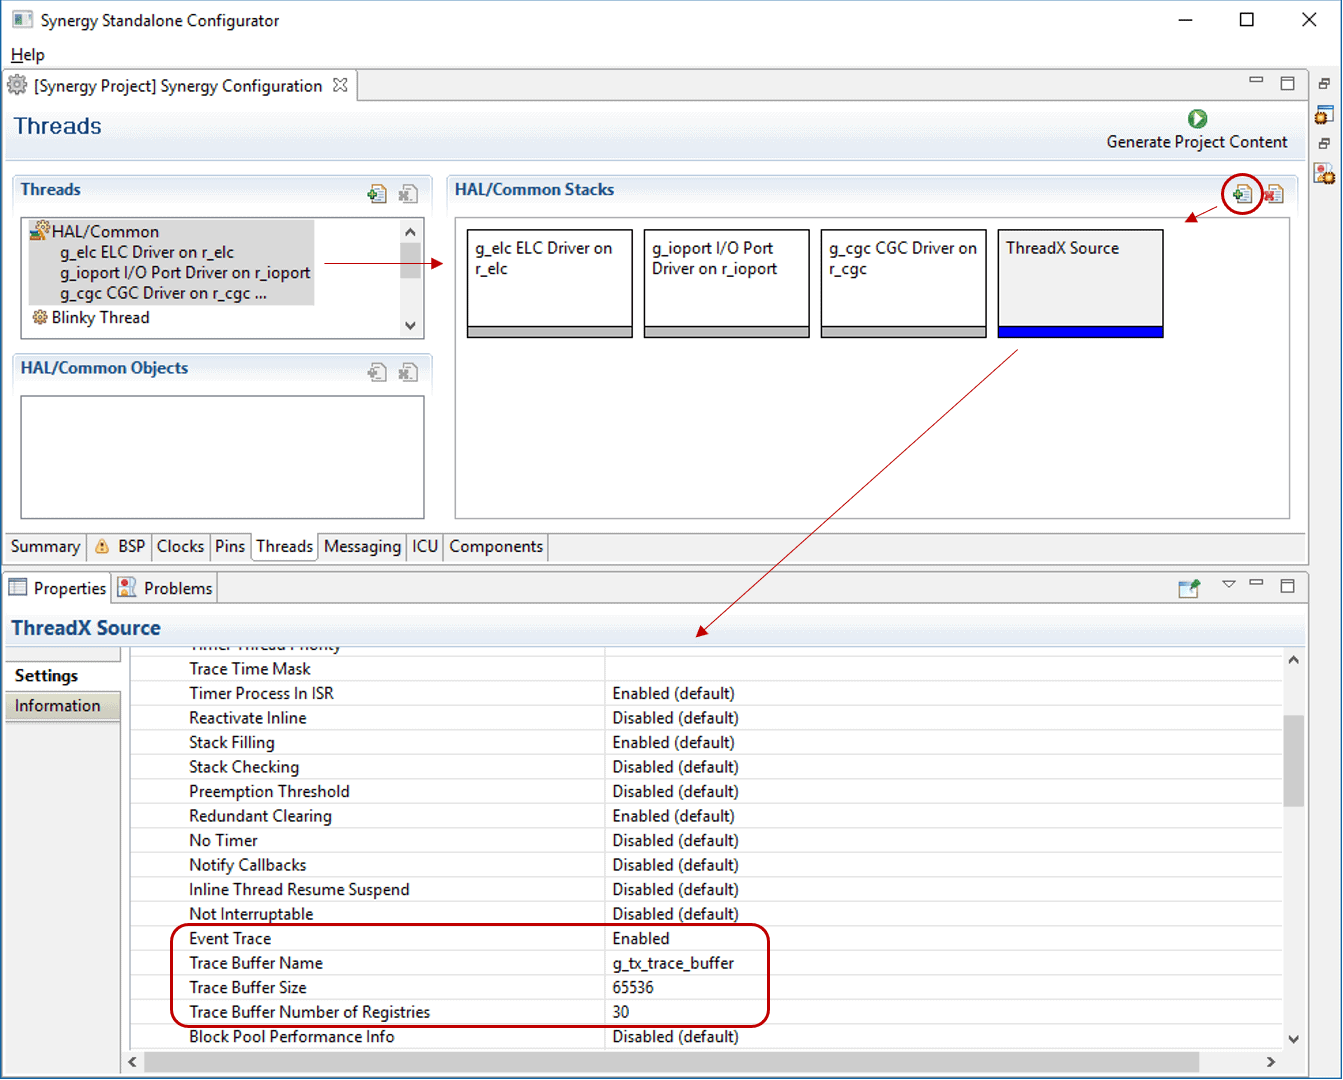
If using Renesas Synergy, you can enable tracing using the Synergy Standalone Configuration tool (SSC). Settings for “Event Trace” are found in the “ThreadX Source” properties, as shown in the above screenshot. Click on the “Threads” tab, “HAL/Common” and then “ThreadX Source”. If “ThreadX Source” is not shown, add it using the “+” button. By setting “Event Trace” property to “Enabled”, the event recorder library will be included and tx_trace_enable is called in the Synergy startup code. Now, the system will save events into the trace buffer, that you may upload to the host PC at any time for analysis in Tracealyzer. The upload is a simple RAM dump in binary format.

The trace buffer works as a “flight recorder” that keeps a trace of the latest events. In Synergy, the trace buffer is 65536 bytes by default, allowing for about 2000 events. But the buffer can be made smaller if there is a lack of RAM, or for that matter, it can be larger if you want longer traces and have RAM to spare. But even a short trace can facilitate debugging a lot, assuming the cause of the error is not too far back in time.
Uploading ThreadX traces using IAR Embedded Workbench
The trace buffer upload can be done in several ways depending on your development tools. In this case, we will demonstrate how this can be automated using IAR Embedded Workbench for Renesas Synergy.
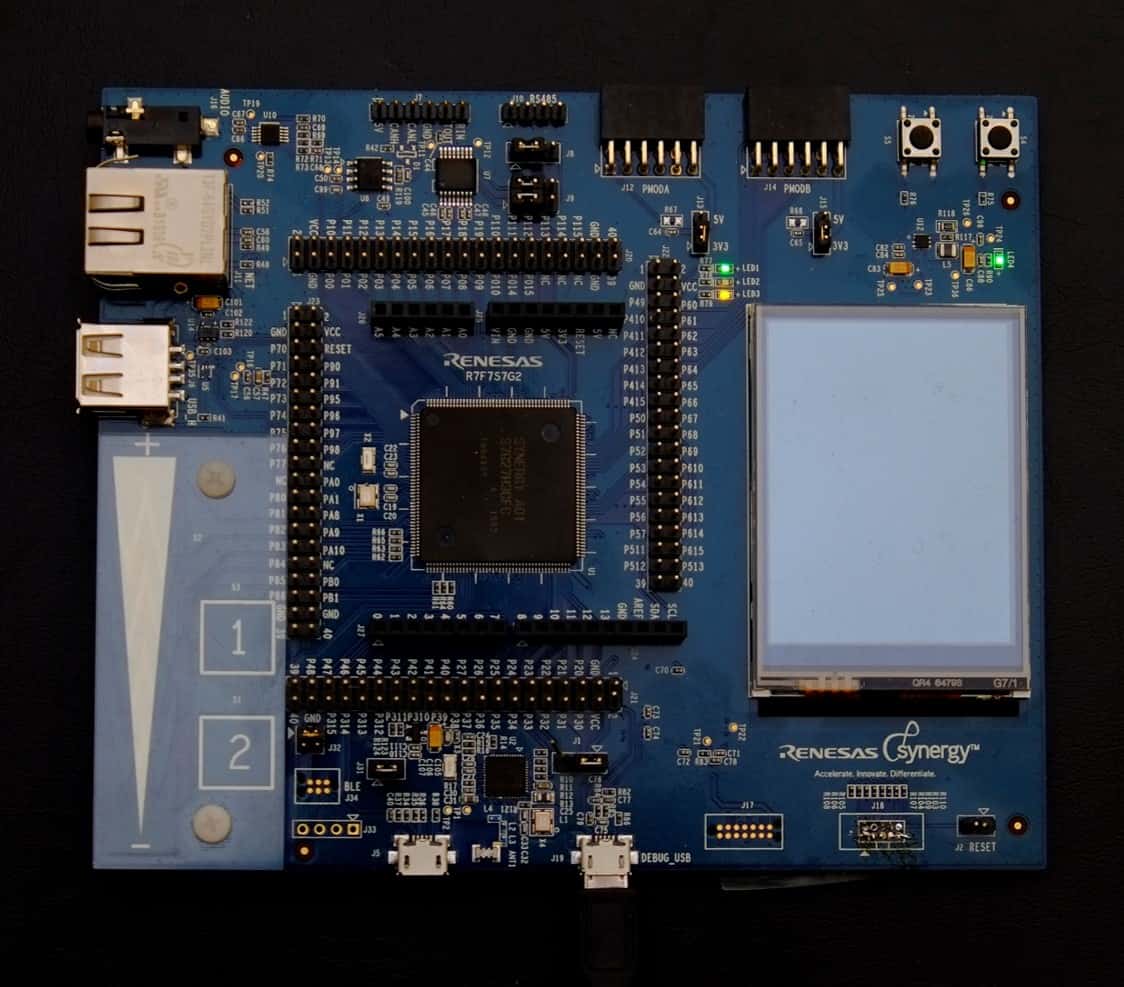
For this demonstration, I have created an IAR project for the Renesas Synergy Starter Kit SK-S7G2, featuring a fast 240 Mhz ARM Cortex-M7 core and an onboard SEGGER J-Link debug probe. The application contains a few threads and ISRs, semaphores, queues and also custom “User events” to log internal events in the application code.
Uploading is simply a matter of saving a RAM dump, which can be made in several ways. The IAR debugger (C-SPY) offers a convenient macro system, that allows for automating this. All we need to do is to look up the address and size of the trace buffer (g_tx_trace_buffer) and save this address range to a file. This can be done using the following C-SPY macro:
__var start;
__var end;

execUserExecutionStopped()
{
   start    = __smessage "Memory:0x",&g_tx_trace_buffer:%x;
   end      = __smessage "Memory:0x",(g_tx_trace_buffer +
                 sizeof(g_tx_trace_buffer)-1):%x;
   __memorySave(start,end,"intel-extended", "$PROJ_DIR$\\trace.trx");
   return 0;
}
Save this code to a macro file named e.g. “save_trace.mac” and register this file in the project options (Debugger -> Use Macro File(s)). Note that by using the function name execUserExecutionStopped, the macro is called automatically whenever the target system is halted, including when single-stepping. You can change this by using a different macro function name, and instead trigger the macro manually or using a breakpoint. Learn more in the User’s Manual, see Saving the Trace.
Analyzing the Trace using Tracealyzer
Now we have a trace file “trace.trx” in the project directory, so let’s open it with Tracealyzer and take a look. To open the trace file, use File -> Open or drag the file into the Tracealyzer main window. To automate this, create a shortcut in the IAR Tools menu, with “trace.trx” as parameter (see Saving the Trace in the User Manual).
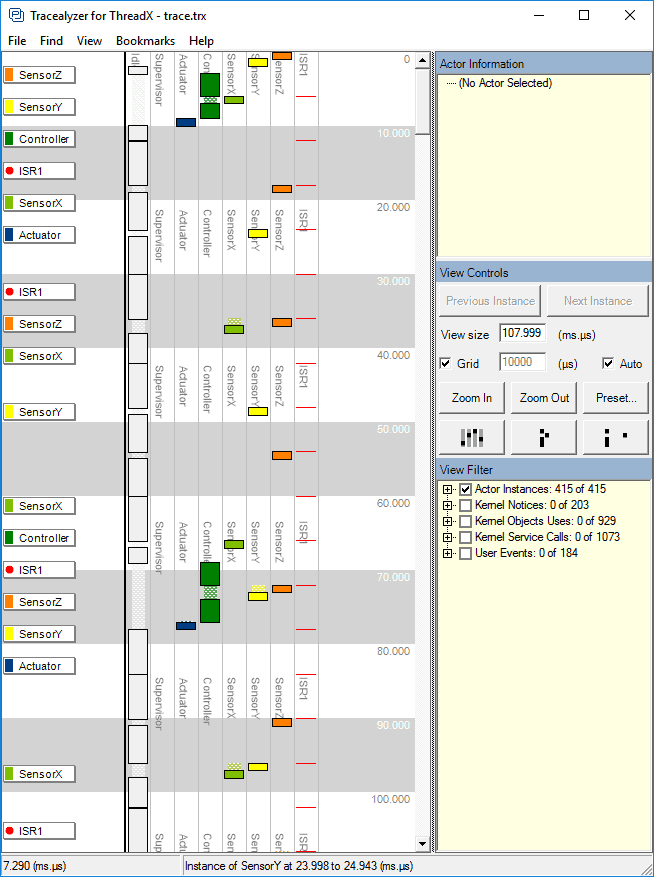
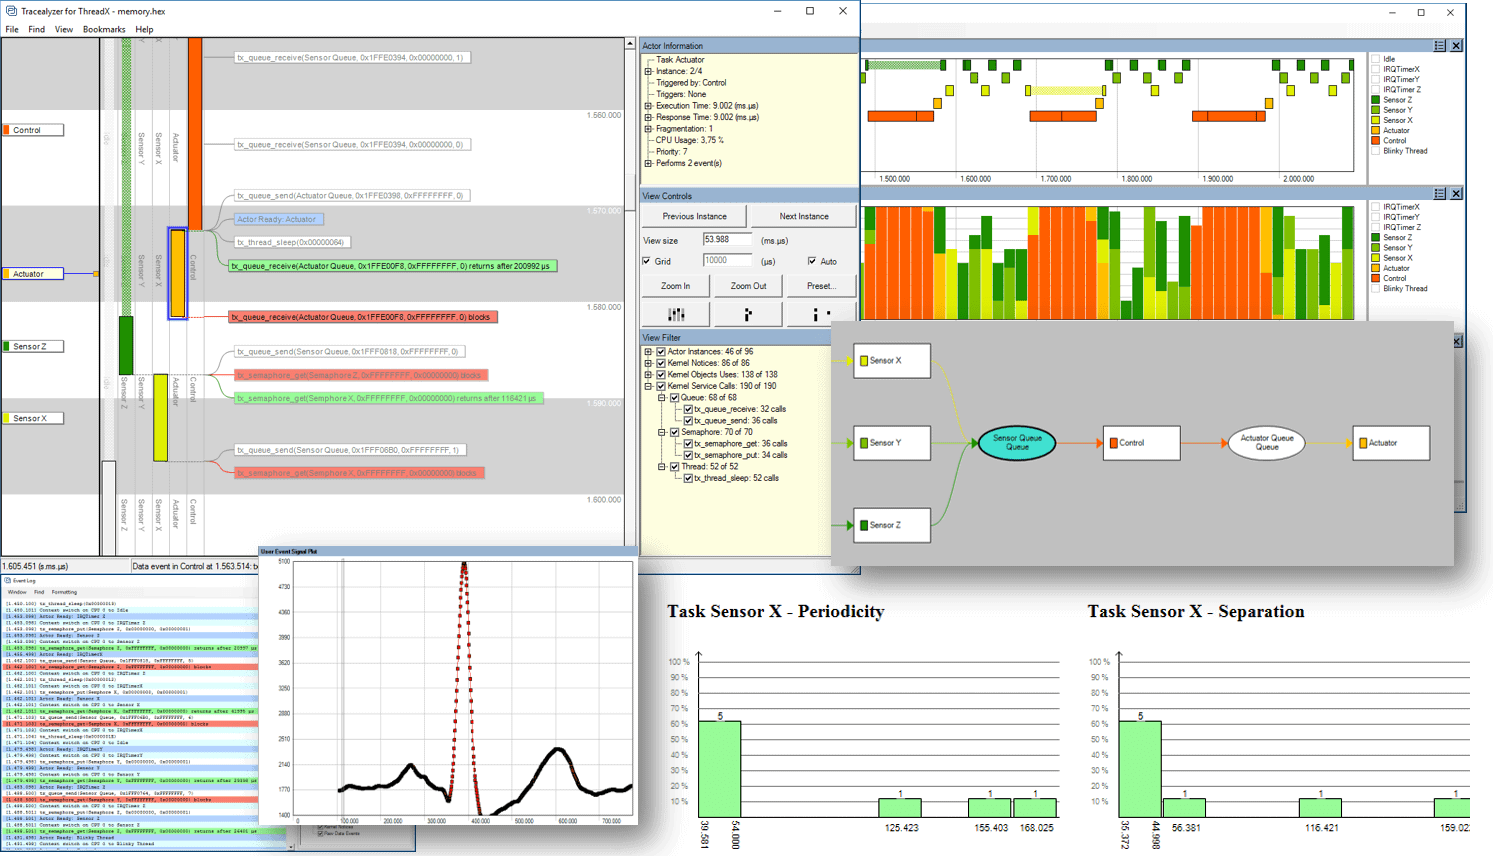
In this view, we see a vertical timeline of the execution of threads and Interrupts, including when they become ready to execute, when they execute (solid rectangles) and when they become blocked or pre-empted by higher priority threads or ISRs.
Time is on the vertical axis, going downwards, with the threads and ISRs on the horizontal axis sorted by their priority. The vertical orientation of the timeline allows for displaying events as horizontal text labels, like ThreadX API calls or custom “User Events” that you generate in your own code. You configure what events that are displayed using the View Filter (bottow right).
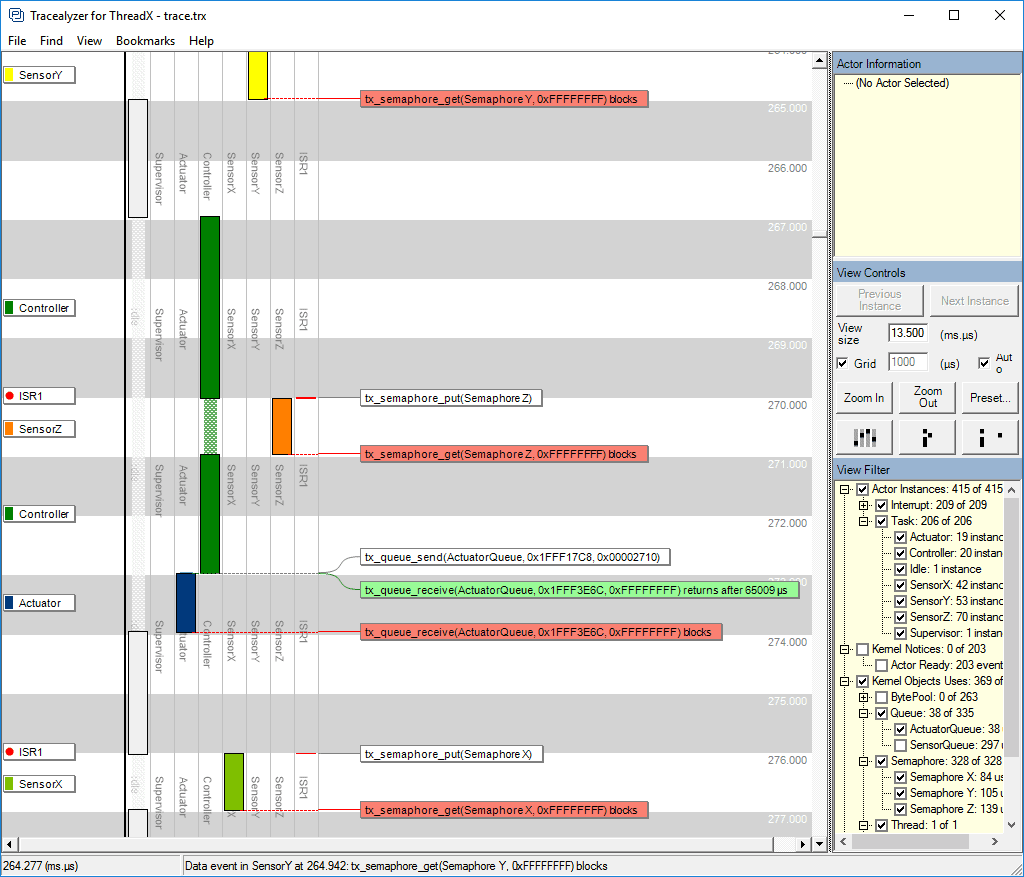
As you can see, even a quite trivial RTOS application may produce rather complex sequences of events when multiple threads interact. Here we see that at 267 ms into the trace, the Controller thread becomes ready to execute. Since only the Idle task was running (the left-most column), the Controller task gets to run directly. However, at 270 ms the ISR1 interrupt signals a semaphore, waking up the SensorZ thread. This has higher priority, so Controller gets pre-empted by SensorZ, that runs and is then blocked again by the semaphore, waiting for the next ISR signal. Controller is then allowed to resume and it sends a message to the Actuator task before finishing. The Actuator task then wakes up to process the message from Controller.
Now, read that section again and compare with the picture. Which is easier to understand?
Another way to visualize a trace is by abstracting it to a dependency graph, where the nodes represent kernel objects such as threads, semaphores and ISRs, and the edges between them show how they communicate. Tracealyzer provides such a view, called “Communication Flow”.
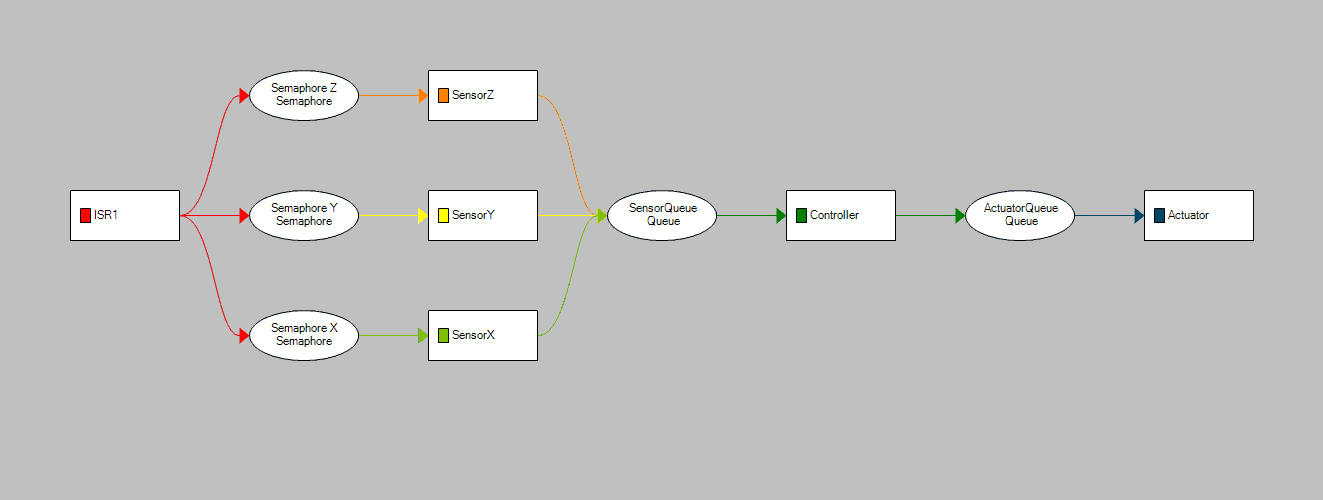
Even if I knew nothing about this code before, I can now see that the system is driven by an interrupt handler (ISR1), that uses three semaphores to trigger three threads, SensorX, SensorY or SensorZ, that sends data a shared message queue, that is read by the Controller thread, that in turn sends data to the Actuator thread. Such relationships are difficult to describe in words, but easy to understand from this a visual diagram like this.
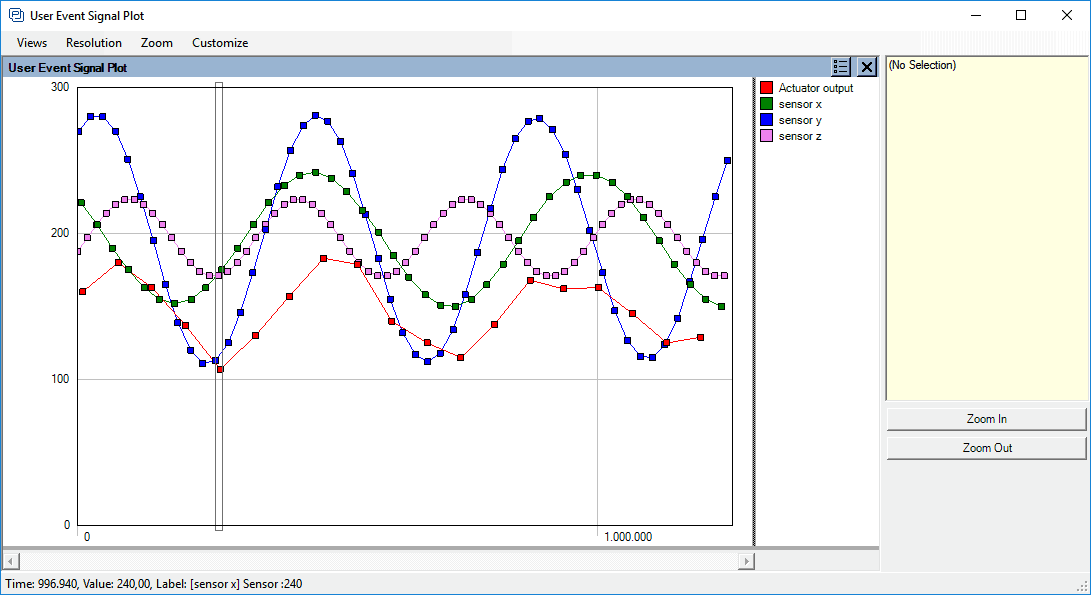
The trace recorder in ThreadX supports custom User Events, allowing the application developer to log just about any event or data of interest. In Tracealyzer this can then be displayed with custom formatting and labels, instead of a numeric display only. A code example from the Sensor X thread:
tx_trace_user_event_insert(SENSORX_EVENT, sensorReading.value, 0, 0, 0);
This can also be used for printf-style debug logging, like “Now the blue button was pressed”, but numeric data can also be plotted, as shown below.
In Tracealyzer for ThreadX there are more than 25 different views, each focusing on one aspect of the system. All these views are interconnected in clever ways, which makes very easy to synchronize views and study the same section of the trace from multiple perspectives. This makes it easier to comprehend the software behavior and spot anomalies.
If you are using ThreadX, either as part of Renesas Synergy or in another context, I would recommend to download Tracealyzer for ThreadX today and give it a shot. You will understand more of your current system after just a few clicks. Learn more at Tracealyzer for ThreadX.
If you would like the source code for this project, or need assistance getting started, contact Niclas at support@percepio.com.