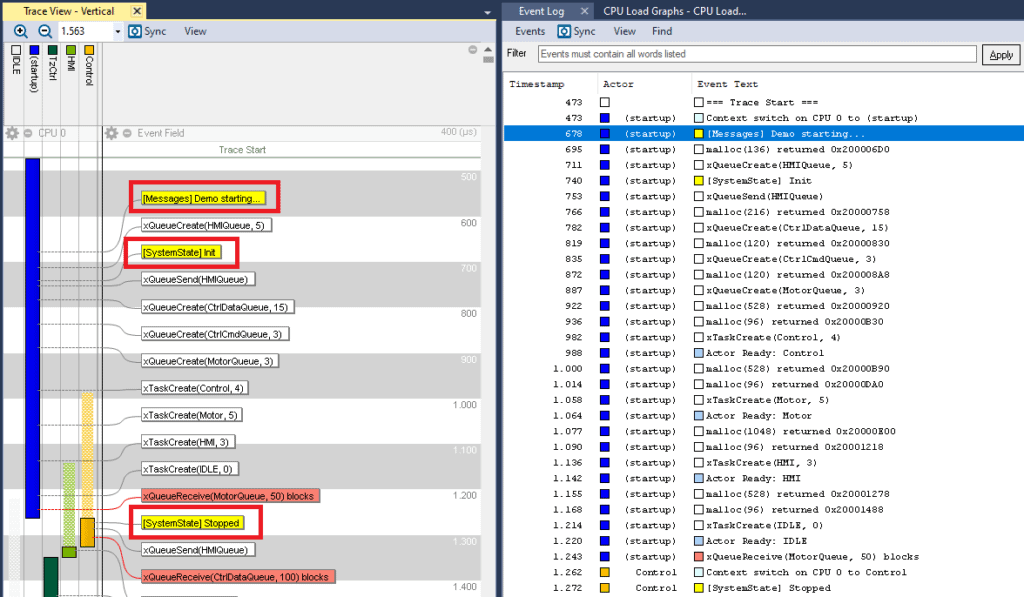
There have been significant improvements in Tracealyzer over the last years. If you haven’t tried it in a while—or if you’re just getting started—here are some tips and tricks that can be handy when analyzing your FreeRTOS applications.
As you may know, the TraceRecorder library automatically records task scheduling and FreeRTOS API calls using the standard trace hooks in the FreeRTOS kernel. Beyond this, TraceRecorder offers an API for custom event tracing, allowing you to capture more detailed information. This is accessed by adding #include “trcRecorder.h” in your source files.
Debug Logging
If you haven’t yet explored the TraceRecorder “print” functions, they work similarly to the classic printf function but displays logged output in Tracealyzer alongside the FreeRTOS task execution and API calls. Moreover, this logging method is significantly faster than sending printf messages over a slow UART, enabling you to add extensive logging without major impact on software timing.
More recently, we’ve also introduced more efficient “compact” logging functions. Rather than copying each string character into the event record, this only logs the string address, i.e .4 bytes on 32-bit devices. Tracealyzer retrieves the string from the ELF file. While this approach works only for constant strings, it greatly reduces execution time and can also reduce the trace data size, especially for longer strings. This article delves deeper into the new logging features, including a performance comparison.
Data Logging and Plotting
Like printf, the TraceRecorder logging functions can accept arguments for data logging. However, unlike printf, these values are stored separately from the format string. The string formatting is offloaded to the Tracealyzer host application. This approach minimizes the logging execution time on the target device and also allows Tracealyzer to plot the logged values in the User Event Signal Plot view.
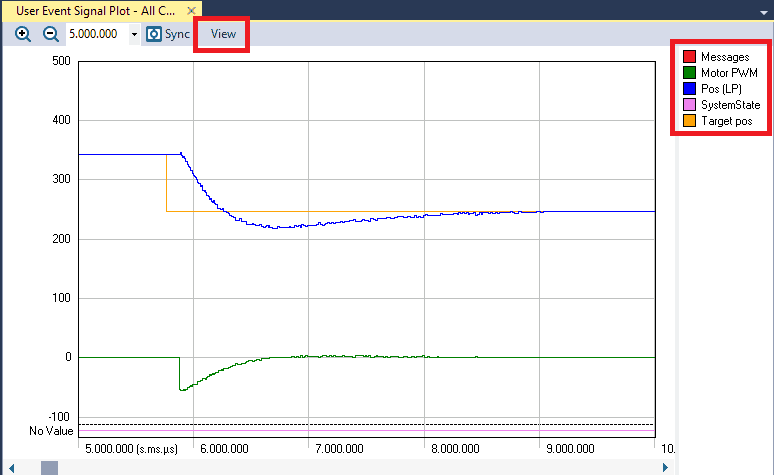
Some tips for the User Event Signal Plot:
- Toggle Visibility: Click on channel names to toggle channel visibility.
- Right-click options: Right-clicking a channel name shows more options, such as “Show Only X” that makes it easy to hide irrelevant data series.
- View menu options: The local “View” menu (next to “Sync”) offers several options for adjusting the view, e.g. “Configure Y-Axis…” that allows for adjusting the Y-axis scale.
- Export Data: The “View” menu also offers the “Export to File” option, that saves a .csv file for data export to other tools.
Intervals
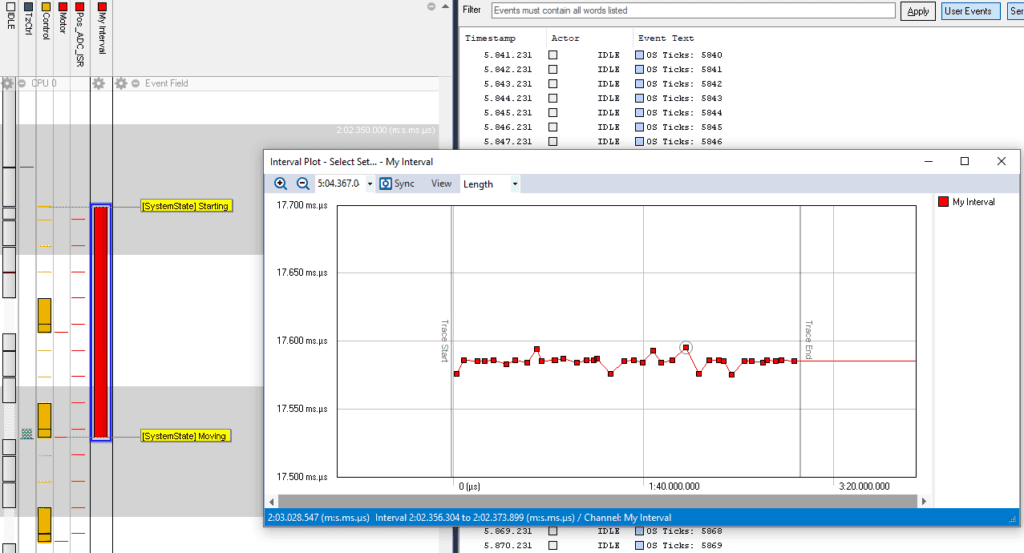
You can measure time between two points in your code with the functions xTraceIntervalStart() and xTraceIntervalStop(). This may span in between different tasks or interrupt handlers, which allows for profiling latency across multiple processing steps. Each occurrence is recorded and displayed as “intervals” in Tracealyzer’s trace view, with high watermark and average duration statistics. For more information on how to use these functions, see trcInterval.h.
A related feature that is perhaps not well known is the Interval Plot, seen above, that display timing variations for intervals. Double-clicking a data point shows the corresponding trace section. The Interval Plot view is found under the main “Views” menu.
States
The xTraceStateMachineSetState() function allows you to log state transitions of any kind and display them in the trace view, similar to a logic analyzer but alongside the FreeRTOS task execution. Each state’s duration is recorded, and statistics are available just like for intervals. A visual state graph is also provided. Refer to trcStateMachine.h for more details.
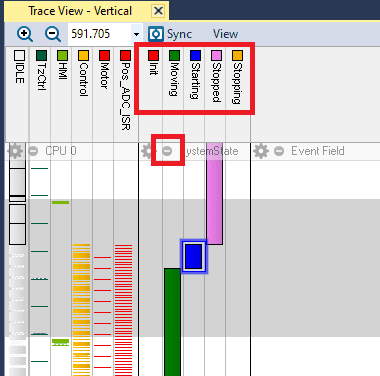
Tips for working with states:
- Finding Occurrences: Left-clicking on state names in the top legend moves to the next occurrence, while right-clicking shows the previous one. Note that the same works also for task names.
- Compress the Field: Use the small “minus” icon to compress the states into a single swimlane, freeing up screen space for other views.
Function-level Profiling
Use xTraceRunnableStart() and xTraceRunnableStop() to trace key functions in your application. While “runnables” originate from automotive software (typically referring to top-level functions), this type of tracing is valuable for any application. Note that runnables can measure any section of code, not only functions, within the specific thread. This allows for detailed execution time statistics and also shows each “runnable” in the trace view, beside the task trace. An limitation is that multiple measurements can’t be nested within the same thread. Learn more in this article.
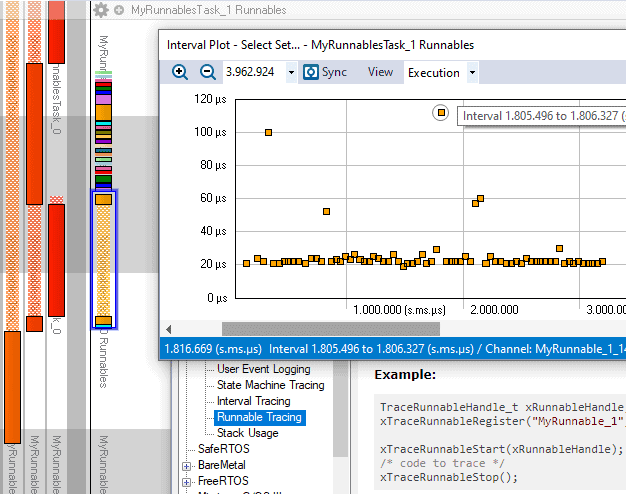
Additional tips for runnable tracing:
- Viewing Statistics: Use the “Actor and Interval Statistics Report” to view timing statistics for each runnable. This view also allows for exporting the data as a report.
- See Timing Variations: The Interval Plot can also show runnables. This way you can display the execution time variations as a time series plot.
A Final Tip
When using TraceRecorder logging features, keep in mind you don’t need to remove the logging calls after your analysis. All TraceRecorder function calls are replaced with empty #define statements when TraceRecorder is disabled, i.e., by setting configUSE_TRACE_FACILITY to 0 in FreeRTOSConfig.h. This means no machine code is generated from these calls. Remember to keep #include “trcRecorder.h” in your source files for this to work.

