Percepio TraceExporter for VS Code makes it easy to export Percepio TraceRecorder snapshots during your debug session and open them directly in Percepio Tracealyzer. This is applicable for embedded systems based on Zephyr, FreeRTOS, SafeRTOS, Cesium, ThreadX or PX5, or using TraceRecorder’s “Bare Metal” option. The extension is currently provided as a downloadable .vsix file but we intend to publish it in VS Code Marketplace soon.
Download it here: percepio-traceexporter-0.3.1.vsix
Prerequisites
- VS Code with gdb-based debugging (e.g. Cortex-Debug, nRF Connect SDK, or other debug extension that accept gdb commands from the Debug Console)
- Percepio TraceRecorder in your build, configured for snapshots using the RingBuffer streamport.
Learn more in the Getting Started Guide for your RTOS.
Usage
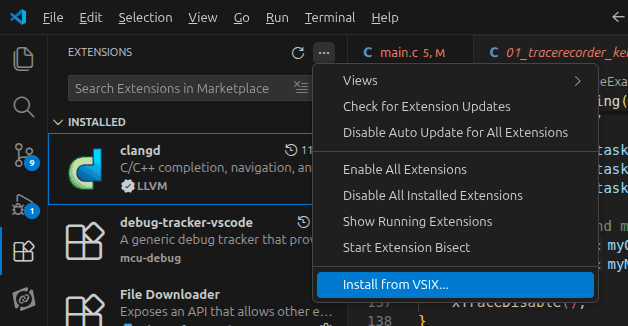
1. To install the extension, open the Extensions panel in VS Code and then the “…” menu, where you select “Install from VSIX…”. Select the downloaded extension file.
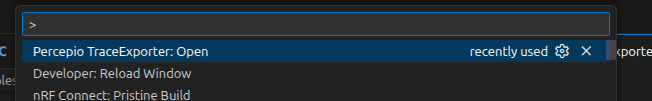
2. Open the TraceExporter from the Command Palette by typing “>” and selecting “Percepio TraceExporter: Open”.
3. Start a debug session and put a break point at a relevant location, or just halt at a random location. Click Save Trace to read out the trace data and store it to a trace file (e.g. trace.bin). Then click View Trace to open the Percepio trace viewer application (Tracealyzer) and load the trace file.
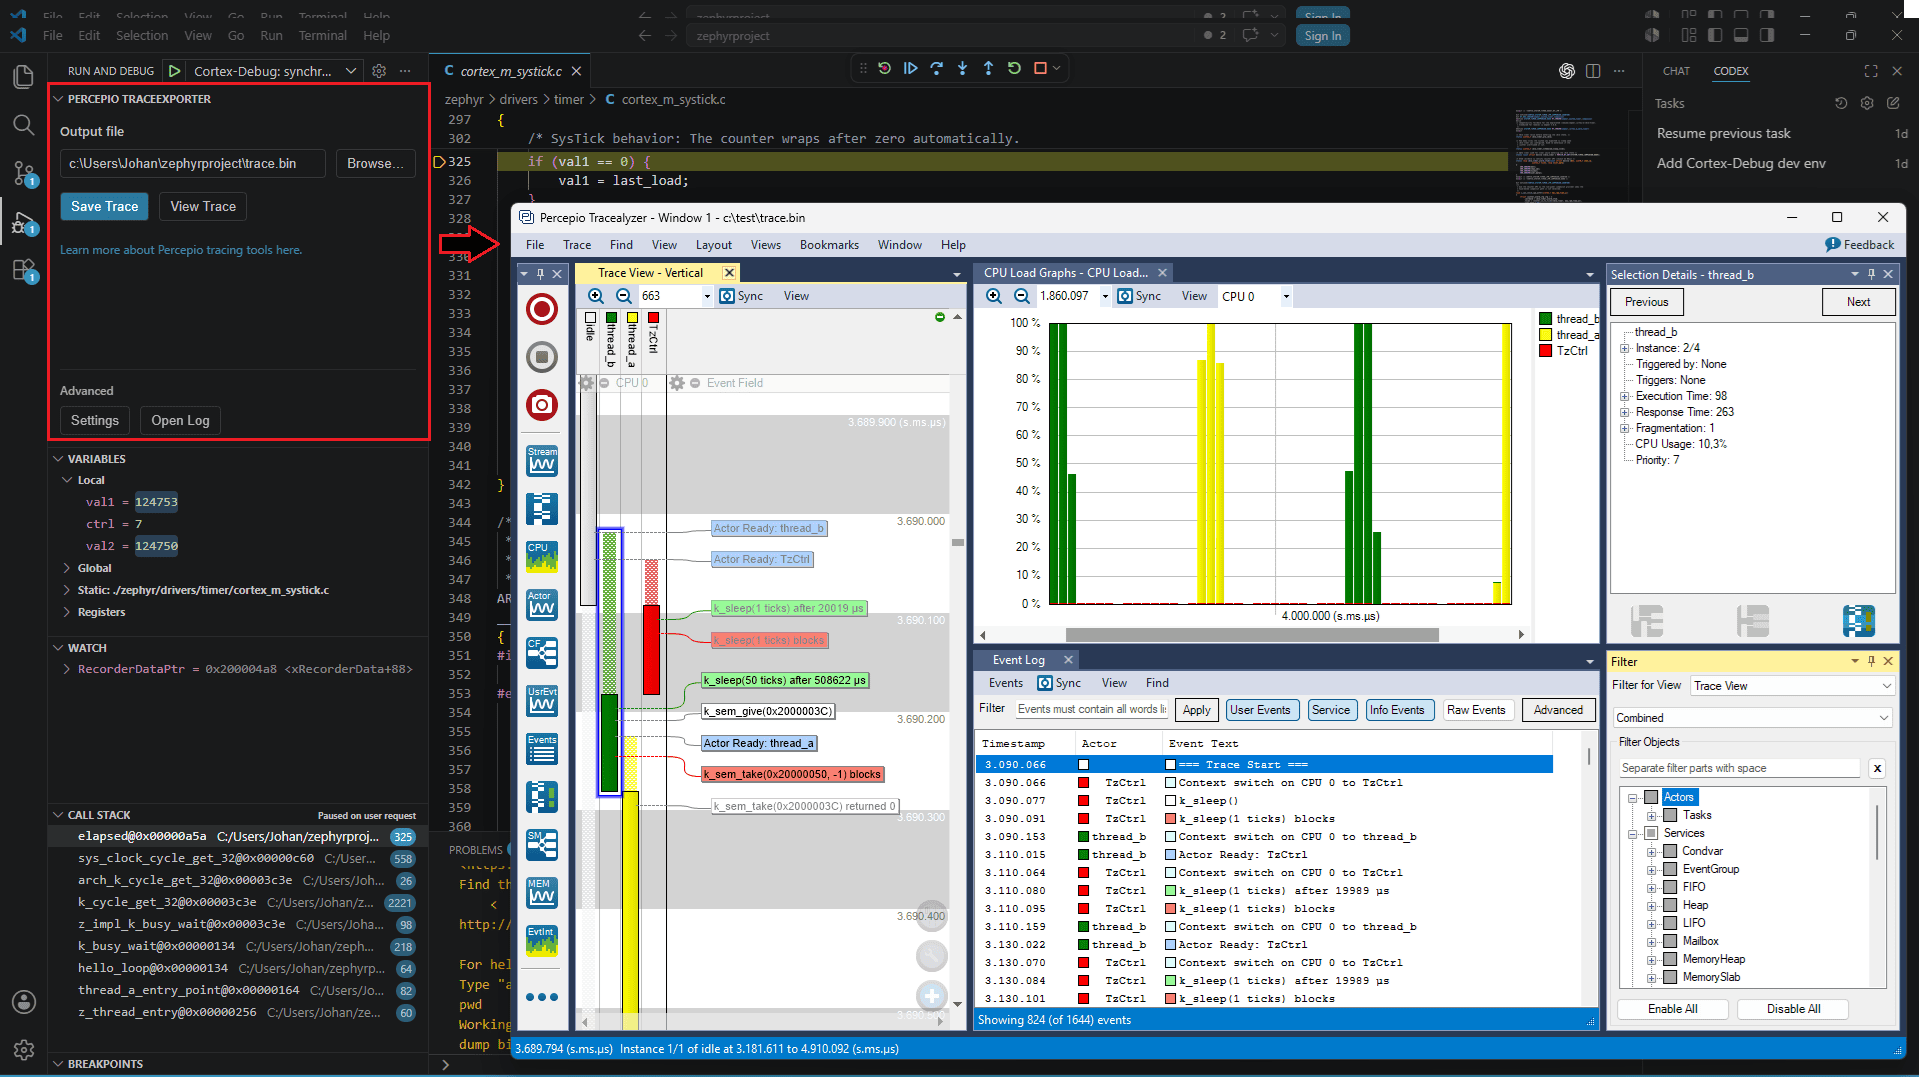
Note that clicking “Save Trace” again will overwrite the same file, so make sure to change the output filename if you want to keep the previous trace. Otherwise, if you choose to overwrite the file, you don’t need to click “Launch Tracealyzer” again. Tracealyzer will detect the updated file and ask if to reload it.
Troubleshooting
If “View Trace” gives an error message, make sure you have installed Percepio Tracealyzer. Then check the Settings for the TraceExporter extension and review the “Tracealyzer Path” setting. Make sure it matches the location of “Tracealyzer.exe” (on Windows) or “launch-tz.sh” (on Linux).
If “Save Trace” gives an error message like “Undefined command” or “Cannot evaluate expression on the specified stack frame”, it is probably because your debugging extension uses an unsupported syntax for running gdb commands. Fortunately, the TraceExporter extension allows for customizing the prefix used when calling gdb, so if you investigate what syntax that is required for running gdb commands in the Debug Console (for example “show version”), you can then apply the right prefix in the “Override gdb prefix” setting as a temporary workaround. In that case, let us know so we can add support for your debugging environment.