This is a part of Tracealyzer Hands On, a series of blog posts with use-case examples for Percepio Tracealyzer®.
In the previous Tracealyzer Hands On post, we discussed how a developer can create a user event channel to monitor events in their application. As you may recall, we also introduced the concept of intervals which is the time between any two events and can be added to the timeline. In this post, we will take the interval concept one step further and see how we can monitor state machines.
Let’s start with a simple example. Suppose that a developer has created a user event channel for a push button, where user events are generated in the interrupt handler. The push button can have two possible states; PB_PRESSED and PB_RELEASED. If the developer runs the code and occasionally presses and releases the push button, they might capture a user event log that looks like the following.
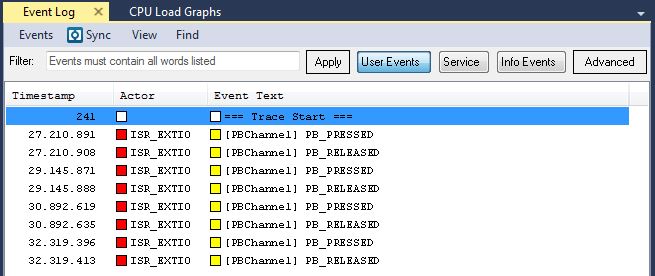
You can see that we have PB_PRESSED and PB_RELEASED events that are being generated by the ISR_EXTIO interrupt. These events can be viewed as a state machine for the push button. In Tracealyzer, state machines generate a special kind of interval, representing the time between state changes as well as the logged state. Let’s create a state machine for our push button example using the following process.
- Click Views -> Intervals and State Machines
- Click “Add Custom State Machine”
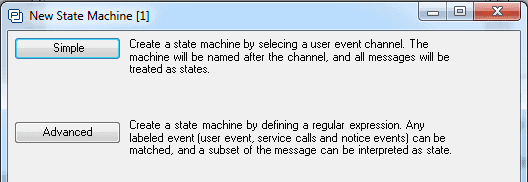
- The New State Machine window will appear with the options for Simple and Advanced. Click Simple.
- From the dropdown, select the user channel name.
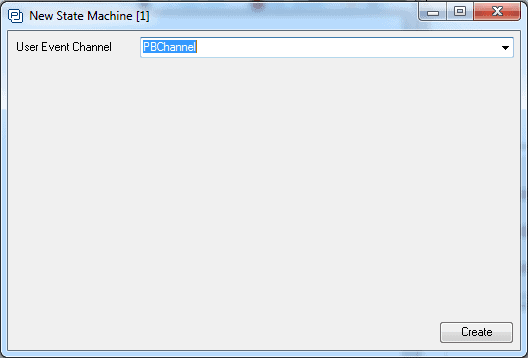
- Click Create
- At this point, you should see PBChannel added to the Intervals and State Machines list. Go ahead and close the State Machines list.
Alternatively, use the trcStateMachine API in TraceRecorder to generate bespoke state events, instead of generic user events. Using state events is more efficient (faster) than using xTracePrint and also avoids the need to configure the state machine visualization on the host computer.
State machines can be visualized just like any other interval in Tracealyzer. The state visualization is very much like a logic analyzer, but for software rather than physical signals. You can see how your system behavior correlates with the system states, and you can show multiple states of relevance in parallel, to see how they overlap. The state machine that we just created will now show up in the trace view alongside our tasks as seen below.
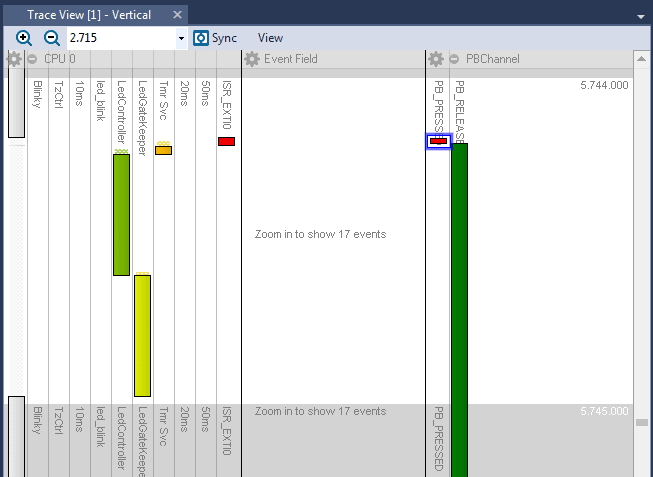
You can see that the PBChannel has been added in the far right of the trace view. We can now examine the trace and see how the push button state changes over time in addition to how the system task behavior may change when the button is pressed. This allows us to more easily identify any potential bugs or issues that may exist in our code by carefully examining states and tasks in parallel.
Note that you can flip the view to a horizontal orientation if you prefer that. Just select “View” -> “Horizontal View”.
This approach for state machine visualization can be used to show any kind of state in the system, as long as the state can be logged on a user event channel. For example, developers can log application state changes, low-level driver states such as USB and TCP/IP states or even hardware states. This only requires the developer to take the time to instrument their state changes with the xTracePrint or xTracePrintF function calls.
Fields in the Trace View
Since v4.2, the trace view is composed of fields. In the above screenshot of the trace view, these are labeled CPU0, Event Field and PBChannel. The two first are shown by default, while PBChannel was added when we defined the state machine. You can however create any number of fields using the View -> Add Field option, e.g. multiple scheduling fields that divides your tasks into logical groups, or multiple state machines. Fields can be reordered and individually configured. You can minimize them on the timeline or close them when no longer relevant. Note the settings gear next to the field name, which provides various options:
- Display size – To adjust the size of the field
- Collapse – to minimize the field
- Select Interval – to change the interval that is displayed in this field
- Close – closes the field in the timeline
State Machine Graphs
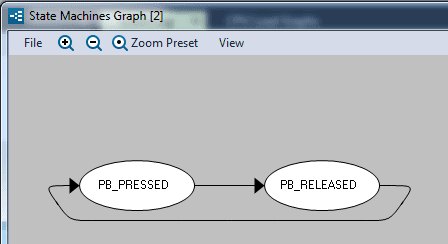
One last trick to discuss today is that once the state machine has been defined, we can view all observed state changes as a graph. To do this, simply click the Views -> State Machines Graph. All the states and the transitions for those states will be graphed which then allows you to go through the graph and make sure that no illegal state transitions occur in the code. For our simple example, the state machine graph looks like the following.
In the next post, we will dig a little bit deeper into state machines and intervals with a more complex example that allows us to examine how we can generate statistics, plots and compute overlays that will allow us to further analyze our applications behavior.
An Expert Tracealyzer Tip
If you have a user event channel that includes state machine data along with other debug information, you can still create a state machine by filtering out only the state data. This can be done by selecting the Advanced option from the new state machine window and developing a regular expression to filter the state data. This can also be applied on other events containing state information, not just user events.
The following links will provide you with additional information on how to construct a regular expression in Tracealyzer:
- Microsoft’s Regular Expressions quick reference
- RegExr, a regex lab with explanations et cetera